
40+ results for "Aerospace"

NYSE Content Update: State Street + NYSE to Celebrate 'Fearless Girl'
NYSE issues a pre-market daily advisory direct from the trading floor. NEW YORK , July 24, 2026 -- The New York Stock Exchange (NYSE) provides a daily pre-market update directly from the NYSE Trading Floor. Access today s NYSE Pre-market update for market insights before trading begins. Ashley Mastronardi delivers the pre-market update on July 24th Traders continue to monitor escalating tensions in the Middle East. As of 8:00 AM ET, ICE Brent Crude Oil is trading at 98 a barrel. Vertical Aerospace chief engineer David King will join NYSE Live to discuss a flurry of headlines the company made this week. Vertical has joined Project VERTI-GO, designed to accelerate the safe integration of electric aircraft into everyday space. The company also says it completed the first public eVTOL flight in England. The NYSE and State Street will come together to celebrate Fearless Girl this afternoon with a summer block party beginning at 2 PM ET.

GracoRoberts Announces Strategic Investment from Tinicum
Partnership Will Accelerate GracoRoberts Growth as a Trusted Supplier of Mission-Critical Materials to the Global Aerospace and Defense Industry ARLINGTON, Texas , July 23, 2026 -- GracoRoberts ( GracoRoberts or the Company ), a leading value-added distributor of specialty chemicals and advanced composite materials to the aerospace and defense industry, today announced a strategic investment from Tinicum, L.P. and affiliated funds managed by Tinicum Incorporated ( Tinicum ). GracoRoberts management team is retaining a significant interest in the Company and will continue to lead the business.

Gastops Delivers 20,000th MetalSCAN® Sensor to the Aerospace Market
OTTAWA, ON , July 21, 2026 - Gastops, a Canadian leader in intelligent condition monitoring and predictive maintenance solutions, announced the delivery of its 20,000th MetalSCAN oil debris monitoring sensor to the aerospace market at the Farnborough International Airshow today. This milestone marks nearly three decades of innovation and collaboration with leading aerospace manufacturers. Gastops began developing MetalSCAN technology in the early 1990s for integration into the Pratt & Whitney F119 engine powering the F-22 Raptor. Following the delivery of the first production unit in 1997, the technology has become a trusted condition monitoring solution across some of the world s most advanced aerospace platforms. Pratt & Whitney is an RTX business.

Solidion Technology (Nasdaq: STI) Adopts SpaceX-Focused Treasury Strategy for Corporate Cash Reserves
Company intends to opportunistically acquire SpaceX shares as a long-term strategic treasury holding, reflecting alignment with the next era of aerospace, energy, and transportation infrastructure DALLAS , June 29, 2026 -- Solidion Technology, Inc. (Nasdaq: STI), an advanced battery materials and technology company, today announced that it intends to opportunistically acquire a position in SpaceX to be held as a strategic treasury asset on the Company s balance sheet. The initial allocation would represent a modest portion of Solidion s sizable current cash on hand, consistent with the Company s disciplined approach to treasury management and its focus on preserving capital for core operations.

NYSE Content Update: Doncasters Shares Jump 42% in NYSE Trading Debut
NYSE issues a pre-market daily advisory direct from the trading floor. NEW YORK , June 26, 2026 -- The New York Stock Exchange (NYSE) provides a daily pre-market update directly from the NYSE Trading Floor. Access today s NYSE Pre-market update for market insights before trading begins. JD Durkin delivers the pre-market update on June 26th Shares of UK manufacturer Doncasters (NYSE: DPC) rose sharply in the first day of trade following its IPO, as investors remain bullish on aerospace and defense. U.S. Bank (NYSE: USB) released its latest Small Business Perspective, revealing that Gen Z business owners are more active in pursuing growth opportunities. The Society for Immunotherapy of Cancer will be hosting a meeting at the NYSE to discuss new strategies in combating cancer. President Dr. James Gulley and SITC Biotech Committee Founding Chair Dr. Zhen Su will join NYSE Live to discuss how the organization. The NYSE is on the ground at today s Uncharted Summit in Southampton, an event bringing together an exclusive group of investors and founders.

NYSE Content Update: Applied Aerospace & Defense Raises $650 Million in IPO
NYSE issues a pre-market daily advisory direct from the trading floor. NEW YORK , June 3, 2026 -- The New York Stock Exchange (NYSE) provides a daily pre-market update directly from the NYSE Trading Floor. Access today s NYSE Pre-market update for market insights before trading begins. Ashley Mastronardi delivers the pre-market update on June 3rd NYSE-parent company Intercontinental Exchange (NYSE: ICE) announced that it s part of Anthropic s cybersecurity initiative, Project Glasswing. Applied Aerospace & Defense (NYSE: AADX) will begin trading on the NYSE today after pricing its IPO at 20 a share. Checkout.com revealed new stablecoin settlement capabilities in a new partnership with Fireblocks. The major averages will look to build off fresh records, with the S&P 500 coming off its first close above 7,600 on Tuesday.
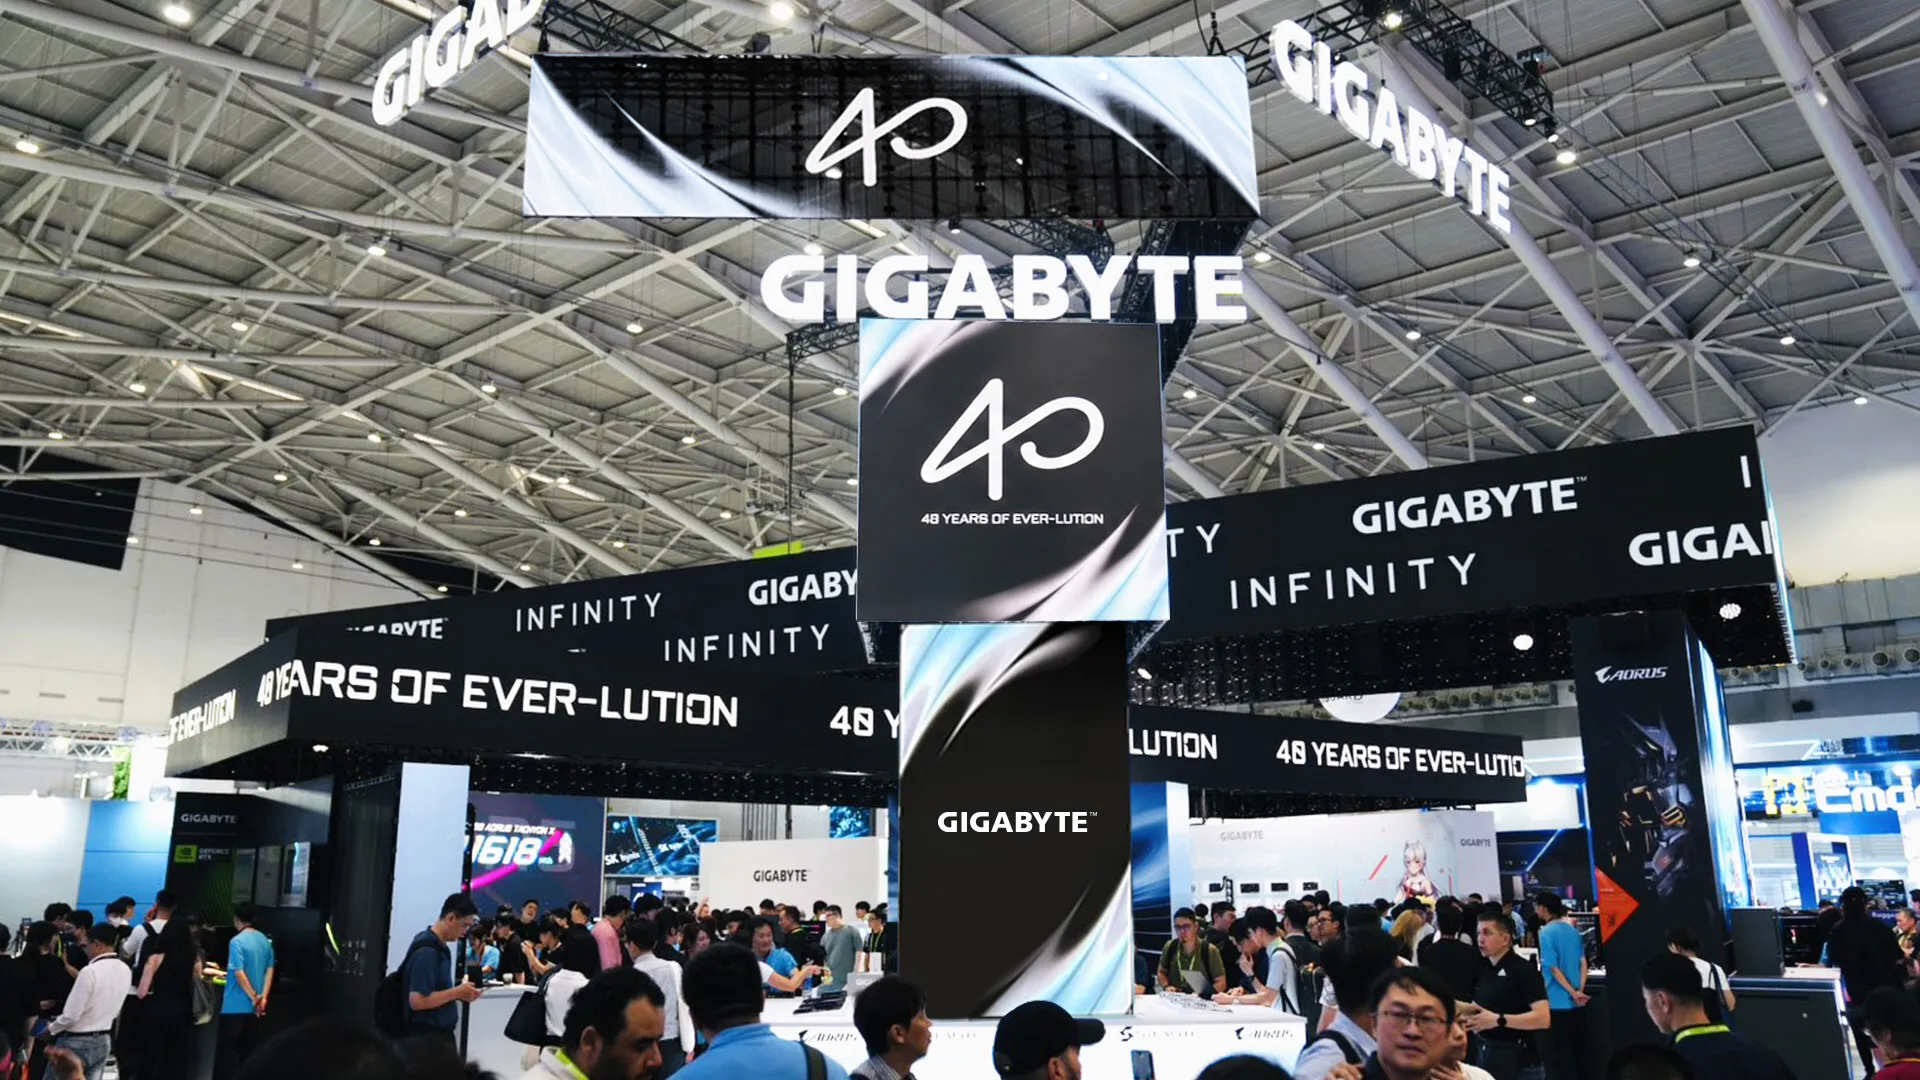
GIGABYTE Opens COMPUTEX 2026 with ENTER INFINITY, Where AI, Gaming, and PC Innovation Unite
TAIPEI , June 2, 2026 -- GIGABYTE, the world s leading computer brand, today officially opened COMPUTEX 2026 under the theme ENTER INFINITY, drawing strong visitor engagement across next-generation PC innovation, gaming, and intelligent computing showcases. Marking its 40th anniversary, GIGABYTE presents ENTER INFINITY not simply as a celebration of its history, but as a continuation of four decades of engineering innovation that shaped the evolution of performance computing. GIGABYTE s premium gaming brand, AORUS, takes center stage with the INFINITY Series, a comprehensive lineup of motherboards, graphics cards, peripherals, and chassis. The lineup is led by the flagship X870E AORUS INFINITY NEXT, pushing limits further with aerospace-inspired engineering, featuring an industry-first 3D metal-printed cooling component and space-grade Quad OptiMOS power architecture built for next-generation AI and high-performance computing.

Gastops Validates ChipCHECK® Debris Analysis Technology for Pratt & Whitney F135 Engine / Lockheed Martin F-35 Lightning II
OTTAWA ON May 27 2026 Gastops Ltd a global leader in intelligent condition monitoring solutions for aerospace and defence applications today announced the successful validation of its next generation debris analysis technology ChipCHECK for use on the Pratt amp Whitney F135 engine powering the Lockheed Martin F35 Lightning II Pratt amp Whitney is an RTX business This milestone is the culmination of Gastops previously announced joint agreement under Canadas Industrial and Technological Benefits ITB policy supported by an investment from RTX The investment enabled a comprehensive ChipCHECK validation program which will bring faster diagnostics reduced turnaround time and maintenance optimization to the F35F135 user community

Syensqo launches strategic review of its Performance & Care segment
Press releaseCommuniqu de presse Regulated Syensqo launches strategic review of its Performance amp Care segment Review aligned with focus to accelerate growth trajectory sharpen capital allocation and maximise value creation Brussels Belgium May 21 2026 0800 CET Syensqo today announces that it has initiated a strategic review of its Performance amp Care segment This is aligned with the Companys intention to focus on becoming a pure play specialty materials and advanced technologies company with a greater exposure to structurally attractive end markets including aerospace and defence electronics healthcare energy and advanced mobility applications Since the start of the year and along with the Board we have undertaken a strategic assessment of our longterm direction and value creation priorities In addition we are fully focused on accelerating our growth trajectory driving more consistent execution sharpening our capital discipline as well as improving cash flow delivery said Mike Radossich Chief Executive Officer of Syensqo Todays announcement reflects our intention to further sharpen our portfolio increase our focus on technologies where we see the strongest longterm growth opportunities and drive sustained innovationled differentiation Accordingly we will now evaluate a range of strategic options for the Performance amp Care segment with an emphasis on maximizing longterm value for our shareholders The Company has not set a defined timetable for the strategic review and will provide further updates when appropriate In addition there can be no assurance or certainty that this process will result in any transaction nor as to the terms or structure of any transaction Syensqos Performance amp Care segment comprising the Novecare and Technology Solutions global business units is a global leader in surface chemistry solutions and specialty mining reagents serving the consumer care agro coatings and mining end markets In 2025 the segment generated net sales of 20 billion and an underlying EBITDA of 358 million About Syensqo Syensqo is a science company developing groundbreaking solutions that enhance the way we live work travel and play Inspired by the scientific councils which Ernest Solvay initiated in 1911 we bring great minds together to push the limits of science and innovation for the benefit of our customers with a diverse global team of more than 13000 associates in 30 countries Our solutions contribute to safer cleaner and more sustainable products found in homes food and consumer goods planes cars batteries smart devices and healthcare applications Our innovation power enables us to deliver on the ambition of a circular economy and explore breakthrough technologies that advance humanity Learn more at wwwsyensqocom Contacts Media Relationsmediarelationssyensqocom Perrine Marchal32 478 32 62 72Laetitia Schreiber32 487 74 38 07Investors amp Analystsinvestorrelationssyensqocom Sherief Bakr44 7920 575 989Robbin MooreRandolph1 470 493 2433Loc Flament32 478 69 74 20Eva Behaeghe32 474 49 23 50 Syensqo tudie des options stratgiques pour son segment Performance amp Care Cette dmarche sinscrit dans la volont du groupe dacclrer sa croissance de renforcer sa discipline dallocation du capital et de maximiser la cration de valeur Bruxelles Belgique 21 mai 2026 0800 CET Syensqo annonce aujourdhui avoir lanc une revue stratgique de son segment Performance amp Care Cette dmarche illustre lintention du Groupe de se concentrer sur son positionnement de pure player en matriaux de spcialit et technologies de pointe plus expos des marchs structurellement porteurs tels que laronautique et la dfense llectronique la sant lnergie et les applications de mobilit avance Depuis le dbut de lanne et avec le soutien du Conseil nous avons engag une rflexion stratgique sur notre trajectoire long terme et nos priorits en matire de cration de valeur Nous sommes pleinement mobiliss pour acclrer notre trajectoire de croissance amliorer notre excution renforcer notre discipline en matire dallocation du capital et amliorer la gnration de flux de trsorerie a dclar Mike Radossich CEO de Syensqo Lannonce de ce jour reflte notre volont daffiner davantage notre portefeuille et de nous recentrer sur les technologies davantage porteuses de croissance long terme avec une diffrenciation durable fonde sur linnovation En consquence nous valuons des options stratgiques pour le segment Performance amp Care dans loptique de maximiser la cration de valeur long terme pour nos actionnaires Lentreprise na pas fix de calendrier dfini pour cette revue stratgique et fournira des mises jour au moment opportun De plus rien ne permet de garantir les modalits ou la structure dune ventuelle transaction ni mme que ce processus aboutira une transaction Le segment Performance amp Care de Syensqo qui regroupe les Global Business Units Novecare et Technology Solutions est un leader mondial des solutions de chimie de surface et des ractifs miniers de spcialit au service des marchs des soins la personne de lagro des revtements et de lextraction minire En 2025 ce segment a gnr un chiffre daffaires net de 20 milliards et un EBITDA sousjacent de 358 millions A propos de Syensqo Syensqo est une entreprise fonde sur la science qui dveloppe des solutions novatrices permettant damliorer notre faon de vivre de travailler de voyager et de nous divertir Inspirs par les congrs scientifiques initis par Ernest Solvay en 1911 nous runissons des talents brillants qui repoussent sans cesse les limites de la science et de linnovation au profit de nos clients avec plus de 13 000 employs Nous dveloppons des solutions qui contribuent offrir des produits plus srs plus propres et plus durables que lon retrouve dans lhabitat lalimentation et les biens de consommation les avions les voitures les batteries les appareils lectroniques et les soins de sant Notre force dinnovation nous permet de concrtiser lambition dune conomie circulaire et dexplorer des technologies rvolutionnaires qui feront progresser lhumanit Plus dinformations sur wwwsyensqocom Contacts Media Relationsmediarelationssyensqocom Perrine Marchal32 478 32 62 72Laetitia Schreiber32 487 74 38 07Investors amp Analystsinvestorrelationssyensqocom Sherief Bakr44 7920 575 989Robbin MooreRandolph1 470 493 2433Loc Flament32 478 69 74 20Eva Behaeghe32 474 49 23 50 Attachments Syensqo launches strategic review PampC EN Syensqo 233tudie des options strat233giques PampC FR

Aitech Awarded $63M Contract for Avionics Computing Solutions to Power India's Light Combat Helicopter Program
Hindustan Aeronautics Limited Selected Aitech for TrustedAvionics Computing Technology and LongTerm Program SupportBENGALURU India May 19 2026 Aitech a leading provider of rugged embedded computing solutions for aerospace and defense announced today a 63 million production contract with Hindustan Aeronautics Limited HAL India to supply missioncritical avionics computing solutions for Indias Light Combat Helicopter LCH program The followon contract supports avionics systems for 156 helicopters and ensures longterm production and sustainment of the Display Mission Computer DMC and related flight systems over the next five to six years
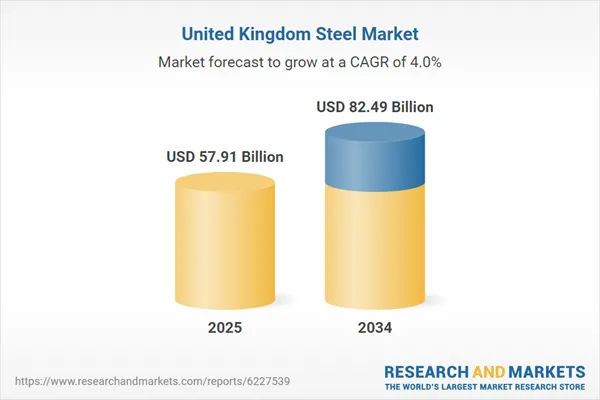
United Kingdom Steel Industry Report 2026 | Now Available
The UK steel market is set to rise from US 5791 billion in 2025 to US 8249 billion by 2034 growing at a CAGR of 401 This growth is fueled by ongoing infrastructural modernization rising electric vehicle production and the increasing use of highstrength sustainable steel across various industries Key sectors include building and construction automotive and renewable energy with London Manchester and Liverpool being major regional hubs The market faces challenges from high energy costs and competitive pressures but remains vital for a sustainable future Notable companies include ArcelorMittal Tata Steel and Nucor Corporation United Kingdom Steel Market United Kingdom Steel Market Dublin April 29 2026 GLOBE NEWSWIRE The United Kingdom Steel Market Report by Type Product Application Cities and Companies Analysis 20262034 report has been added to ResearchAndMarketscoms offeringThe UK steel market is anticipated to surge from US 5791 Billion in 2025 to US 8249 Billion in 2034 driven by continuous demand from building and construction infrastructure automotive and renewable energy industries The market is expected to grow at a CAGR of 401 from 20262034 due to ongoing infrastructural modernization electric vehicle production growth and the increasing application of high strength and sustainable steel grades in various industrial uses Within the United Kingdom steel has long been a backbone in industrial development and remains strategically important to this very day The construction sector in the UK is very dependent on structural and reinforcing steel in various building works bridges and infrastructure projects Other key sectors that rely on highquality steel grades include automotive manufacturing aerospace shipbuilding and railways The growth in renewable energymainly wind farms and transmission infrastructurealso contributes to higher demand Furthermore efforts within the UK toward netzero targets spur on innovative production methods for lowcarbon and recycled steelGrowth Drivers in the United Kingdom Steel Market Infrastructure Modernisation amp Urban DevelopmentOne of the main drivers of growth in the UK steel market is the continuing requirement for national infrastructure upgrade and extension Thus investment in transport networks rail roads ports airports and urban regeneration projects relies heavily on steel for structural frameworks bridges stations and associated civil works Similarly major urban redevelopment involving former industrial sites into mixeduse commercial and residential zones increases demand for beams rebar and fabricated steel components Population growth in larger cities also drives mid and highrise construction along with the development of logistics hubs warehouses and data centersall very steelintensive Publicprivate partnership models and longterm infrastructure programs create relatively predictable demand pipelinesTransition to LowCarbon Economy amp Renewable Energy ProjectsThe UK government has put in place legally binding obligations to reach netzero greenhouse gas emissions by 2050 The current governments Clean Power 2030 Action Plan aims at 100 clean power by 2030 The UKs decarbonization agenda and netzero commitments are driving new steel demand in energy and green industrial projects Onshore and offshore wind farms solar mounting structures grid reinforcement and battery storage facilities all require substantial volumes of highquality steel The buildout of hydrogen carbon capture and energy transition infrastructure further supports demand for specialized steel grades and tubular products At the same time policy pressure accelerates investment in more energyefficient buildings retrofits and transport systems which often incorporate steel solutions TotalEnergies is actively deploying its integrated power strategy with a renewable portfolio in the UK that includes 11GW of installed capacity and 45GW under development in offshore wind and solar projects In late 2025 TotalEnergies acquired a pipeline of 350MW of solar and 85MW of battery projects expected to be operational by 2028Industrial Manufacturing Automotive amp Reshoring TrendsManufacturing remains a key driver of steel consumption in the UK particularly in automotive engineered products machinery packaging and fabricated components The drive for industrial resilience supplychain security and selective reshoring or nearshoring of production supports local steel usage Automotive manufacturers use flat and coated steels in body structures chassis parts safety components and increasingly in electric vehicle platforms and battery housings Engineering and machinery companies use steel in frames pressure vessels pipelines and equipment Growth in logistics warehousing and ecommerce drives demand for racking shelving and structural systemsChallenges in the United Kingdom Steel Market Energy Costs Environmental Regulation amp Competitiveness PressureA major challenge for the UK steel industry is the combination of high energy costs and stringent environmental regulations that can undermine competitiveness compared with overseas producers Steelmaking is energyintensive and fluctuating power and gas prices affect production margins At the same time tightening carbon and emissions policies require investment in cleaner technologies process efficiency and potentially new production routes While such shifts are crucial for longterm sustainability they tend to increase short to mediumterm capital and operating costs Imported steel from regions with lower energy prices or less strict environmental regimes puts added pressure on domestic producers pricing powerImport Competition Cyclic Demand amp Margin VolatilityThe UK steel market is exposed to global price cycles currency movements and import competition from lowercost producers At times of global overcapacity surges in imported flat long or specialty products can put downward pressure on domestic prices Demand from key enduse sectors including construction and automotive is equally cyclical with order books and utilisation rates fluctuating accordingly Volatility of this nature limits the ability of longterm planning and stability of the workforce Customers are increasingly expecting competitive prices and tight delivery schedules together with tailored products while supply chains remain vulnerable to disruptions in logistics and raw material availability Key Attributes Report AttributeDetailsNo of Pages200Forecast Period2025 2034Estimated Market Value USD in 20255791 BillionForecasted Market Value USD by 20348249 BillionCompound Annual Growth Rate40Regions CoveredUnited Kingdom Company AnalysisOverviews Key Person Recent Developments SWOT Analysis Revenue Analysis ArcelorMittal SAGerdau SAHyundai Steel Co LtdJFE Steel Corporation JFE Holdings IncJiangsu Shagang Group Co LtdNippon Steel CorporationNucor CorporationShougang Group Co LtdTata Steel Ltd Tata GroupUnited States Steel Corporation Market Segmentations Type Flat SteelLong Steel Product Structural SteelPrestressing SteelBright SteelWelding Wire and RodIron Steel WireRopesBraids Application Building and ConstructionElectrical AppliancesMetal ProductsAutomotiveTransportationMechanical EquipmentDomestic Appliances Cities LondonManchesterBirminghamLeedsLiverpoolEdinburghGlasgowTynesideBristolRest of United Kingdom For more information about this report visit httpswwwresearchandmarketscomrw5c7es About ResearchAndMarketscomResearchAndMarketscom is the worlds leading source for international market research reports and market data We provide you with the latest data on international and regional markets key industries the top companies new products and the latest trends Attachment United Kingdom Steel Market CONTACT CONTACT ResearchAndMarketscom Laura WoodSenior Press Manager pressresearchandmarketscom For EST Office Hours Call 19173000470 For US CAN Toll Free Call 18005268630 For GMT Office Hours Call 35314168900

Syntec Optics (Nasdaq: OPTX) Announces Pricing of $20 Million Underwritten Public Offering of Common Stock
ROCHESTER NEW YORK April 28 2026 GLOBE NEWSWIRE Syntec Optics Holdings Inc Nasdaq OPTX Syntec Optics Syntec or the Company a leading provider of technology to defense tech and other vibrant endmarkets today announced the pricing of an underwritten public offering of 2857142 shares of its common stock at a public offering price of 700 per share HC Wainwright amp Co is acting as sole bookrunning manager for the offering In addition the Company granted the underwriter a 30day option to purchase up to 428571 additional shares of its common stock at the public offering price less the underwriting discounts and commissions The offering is expected to close on or about April 30 2026 subject to the satisfaction of customary closing conditions The gross proceeds of the offering are expected to be approximately 20 million prior to deducting underwriting discounts and commissions and offering expenses and excluding any exercise of the option to purchase additional shares The Company intends to use the net proceeds from the offering to acquire or invest in complementary businesses technologies products or assets and for working capital capital expenditures and to optimize the Companys capital structure including potential repayment of indebtedness The shares of common stock described above are being offered by the Company pursuant to a registration statement on Form S1 File No 333295335 that was previously filed with the US Securities and Exchange Commission the SEC and declared effective on April 28 2026 The offering is being made only by means of a prospectus A preliminary prospectus relating to and describing the terms of the offering has been filed with the SEC Electronic copies of the preliminary prospectus and when available copies of the final prospectus relating to the offering may be obtained for free by visiting the SECs website at wwwsecgov or by contacting HC Wainwright amp Co LLC 430 Park Avenue 3rd Floor New York New York 10022 by phone at 212 8565711 or email at placementshcwcocom This press release does not constitute an offer to sell or the solicitation of an offer to buy nor shall there be any sale of these securities in any state or jurisdiction in which such offer solicitation or sale would be unlawful prior to the registration or qualification under the securities laws of any such state or jurisdiction About Syntec Optics Syntec Optics Holdings Inc Nasdaq OPTX headquartered in Rochester NY is one of the largest custom and diverse endmarket optics and photonics manufacturers in the United States Operating for over two decades Syntec Optics runs a stateoftheart facility with extensive core capabilities of various optics manufacturing processes both horizontally and vertically integrated to provide a competitive advantage for missioncritical OEMs As more products become lightenabled Syntec Optics continues to add new product lines including recent Low Earth Orbit LEO satellite optics for communications lightweight nightvision goggle optics for defense biomedical optics for diagnostics and surgery and data center optics for Artificial Intelligence According toSPIE across the entire field of optics and photonics the monetary value of all lightenabled products and related services amounts to over 15 of worldwide economic output nearly 16 trillion of the total 106 trillion value of all finished goods and services produced worldwide in 2023 To learn more visitwwwsyntecopticscom ForwardLooking Statements This press release contains certain forwardlooking statements within the meaning of the United States Private Securities Litigation Reform Act of 1995 Section 27A of the Securities Act of 1933 as amended the Securities Act and Section 21E of the Securities Exchange Act of 1934 as amended All statements other than statements of historical fact contained in this press release including statements as to the completion of the public offering the satisfaction of customary closing conditions related to the public offering and the intended use of net proceeds from the public offering are forwardlooking statements are forwardlooking statements Some of these forwardlooking statements can be identified by the use of forwardlooking words including may should expect intend will estimate anticipate believe predict plan targets projects could would continue forecast or the negatives of these terms or variations of them or similar expressions All forwardlooking statements are subject to risks uncertainties and other factors some of which are beyond the control of Syntec Optics which could cause actual results to differ materially from those expressed or implied by such forwardlooking statements All forwardlooking statements are based upon estimates forecasts and assumptions that while considered reasonable by Syntec Optics and its management as the case may be are inherently uncertain and many factors may cause the actual results to differ materially from current expectations which include but are not limited to 1 risk outlined in any prior SEC filings 2 ability of Syntec Optics to successfully increase market penetration into its target markets 3 the addressable markets that Syntec Optics intends to target do not grow as expected 4 the loss of any key executives 5 the loss of any relationships with key suppliers including suppliers abroad 6 the loss of any relationships with key customers 7 the inability to protect Syntec Optics patents and other intellectual property 8 the failure to successfully execute manufacturing of announced products in a timely manner or at all or to scale to mass production 9 costs related to any further business combination 10 changes in applicable laws or regulations 11 the possibility that Syntec Optics may be adversely affected by other economic business andor competitive factors 12 Syntec Optics estimates of its growth and projected financial results for the future and meeting or satisfying the underlying assumptions with respect thereto 13 the impact of any pandemic including any mutations or variants thereof and the RussianUkrainian or Israeli conflict and any resulting effect on business and financial conditions 14 inability to complete any investments or borrowings in connection with any organic or inorganic growth 15 the potential for events or circumstances that result in Syntec Optics failure to timely achieve the anticipated benefits of Syntec Optics customer arrangements and 16 other risks and uncertainties set forth in the sections entitled Risk Factors and Cautionary Note Regarding ForwardLooking Statements in prior SEC filings including registration statement on Form S1 filed with the SEC These filings identify and address other important risks and uncertainties that could cause actual events and results to differ materially from those contained in the forwardlooking statements Nothing in this press release should be regarded as a representation by any person that the forwardlooking statements set forth herein will be achieved or that any of the contemplated results of such forwardlooking statements will be achieved You should not place undue reliance on forwardlooking statements which speak only as of the date they are made Syntec Optics does not give any assurance that Syntec Optics will achieve its expected results Syntec Optics does not undertake any duty to update these forwardlooking statements except as otherwise required by law For further information please contact Investor Relations InvestorRelationssyntecopticscom

American Fusion Inc. (OTC: AMFN) Launches Government Procurement Services Segment and Announces Initial Transaction Supporting Canadian Defense Requirement
SOUTHLAKE Texas April 28 2026 GLOBE NEWSWIRE American Fusion Inc OTC AMFN American Fusion or the Company an advanced energy platform company focused on fusion technologies and strategic institutional market opportunities today announced the expansion of a Government Procurement Services segment led by Government Strategy and Procurement Advisor Samuel Reid and an initial transaction within that operating segment supporting a Canadian defense requirement As part of that activity the Company has received a purchase order from Effective Acceleration Ventures Ltd EAV for the supply of two 53100A Phase Noise Analyzer units PN 09053100000 in support of a Canadian Department of National Defence DND Quality Engineering Test Establishment QETE requirement under DND Contract W8486260222A Effective Acceleration Ventures Ltd is the Canadian prime contractor and contractor of record to DNDQETE American Fusion is acting as a United States sourceofsupply vendor to EAV for Microchip Technology Inc OEM instrumentation required under the contract Samuel Reid serves as Government Strategy and Procurement Advisor to American Fusion and separately serves as a director of EAV The Companys Government Procurement Services segment is intended to complement and remain separate from its core fusion energy development activities conducted through Kepler Fusion Technologies and the Texatron platform Transaction Overview AMFN Role US SourceofSupply VendorPrime Contractor Effective Acceleration Ventures Ltd EAVEnd User Canadian Department of National Defence QETEEquipment Two 53100A Phase Noise Analyzer units Microchip Technology Inc OEM hardwarePurchase Order Value Approximately 58000 excluding shipping and related passthrough costsContract Reference DND Contract W8486260222A The equipment supplied is a precision RF and timing measurement instrument used for oscillator characterization phase noise analysis frequency stability measurement jitter evaluation and related signal integrity applications relevant to defense aerospace communications and highperformance electronics environments Strategic Significance While modest in initial size the transaction is strategically meaningful Represents an initial transaction within the Companys Government Procurement Services operating trackSupports expansion into government and institutional procurement channelsDemonstrates capability to participate in specialized technical sourcing and defense supply chainsMay provide a foundation for additional sourcing opportunities in related markets This transaction is not expected to be material to the Companys financial statements by itself but management views it as a practical demonstration of the Companys ability to participate in specialized technical procurement channels while advancing broader institutional market relationships Revenue recognition remains subject to delivery acceptance payment and applicable accounting review Brent Nelson Founder and Executive Director of American Fusion stated This is an important milestone because it demonstrates our ability to participate in realworld procurement environments through an ancillary operating track distinct from our fusion development activities We believe engagements of this type can support broader institutional relationships over time Richard Hawkins CEO of American Fusion added This transaction is an important proof point for our strategy and for the launch of Government Procurement Services as a complementary operating segment alongside our core fusion development activities Government Procurement Services American Fusion is developing Government Procurement Services as an ancillary operating capability focused on technical sourcing compliant supply support and participation in institutional procurement channels led by Government Strategy and Procurement Advisor Samuel Reid The transaction was originated and coordinated with support from Mr Reid who also serves as Director of Effective Acceleration Ventures Ltd the Canadian contractor of record for the DNDQETE requirement Samuel Reid added This transaction demonstrates how American Fusion can integrate into existing government procurement frameworks By aligning with prime contractors and institutional buyers the Company is building a pathway into defense Department of Energy and NATOrelated opportunities where both technical capability and procurement execution matter The 53100A Phase Noise Analyzer is Microchip Technology Inc OEM equipment and is not proprietary American Fusion hardware The Company intends to furnish a Current Report on Form 8K with the US Securities and Exchange Commission regarding the matters described herein For more information about American Fusion please visit americanfusionenergycom About Kepler Fusion Technologies Kepler Fusion Technologies is an advanced energy technology company developing the Texatron aneutronic fusion platform Keplers technology is designed to support modular infrastructuregrade deployment for industrial commercial and gridconstrained applications The Companys development strategy emphasizes systemlevel engineering disciplined intellectual property protection and scalable architectures intended to support longterm commercial operation Kepler Fusion Technologies operates as a wholly owned subsidiary of American Fusion Inc OTC AMFN For more information about Kepler Fusion Technologies and its Texatron platform please visit wwwkeplerfusioncom ForwardLooking Statements This press release contains forwardlooking statements within the meaning of Section 27A of the Securities Act of 1933 and Section 21E of the Securities Exchange Act of 1934 including statements regarding the Companys plans objectives expectations and intentions such as statements relating to technology development and commercialization patent filings regulatory initiatives SEC registration including the expected effectiveness of the Companys Form 10 audit completion exchange uplisting and future business operations Words such as anticipate believe expect intend may plan potential should and will identify forwardlooking statements These statements are based on current expectations and involve risks and uncertainties that could cause actual results to differ materially including risks related to technology development intellectual property protection regulatory approvals capital availability audit and SEC reporting timelines including the timing and effectiveness of the Companys Form 10 exchange requirements litigation matters and general market and economic conditions This release is provided for informational purposes only and does not constitute an offer to sell or a solicitation of an offer to buy any securities The Company undertakes no obligation to update forwardlooking statements except as required by law Corporate Communications IBNAustin TexaswwwInvestorBrandNetworkcom5123547000 OfficeEditorInvestorBrandNetworkcom
ProLogium Wins Edison Award for the Third Time
NextGeneration SolidState Battery Technology Earns Global Recognition AgainTAIPEI Taiwan April 24 2026 GLOBE NEWSWIRE On April 16 the Edison Awards widely regarded as the Oscars of Innovation held its annual gala in Fort Myers Florida USA On this global stage where leading technology companies showcase their RampD excellence ProLogium was honored with a Gold Award in the Battery Materials amp Manufacturing category under Material Science for its proprietary Gen 4 Technology Superfluidized AllInorganic SolidState Lithium Ceramic Battery This marks ProLogiums third Edison Award reaffirming international recognition of its continued innovation in nextgeneration solidstate batteries from safety mechanisms and material systems to manufacturing platforms It further validates that ProLogiums battery platform built on a superfluidized allinorganic electrolyte all ceramic separator and 100 silicon anode is advancing solidstate batteries toward industrialization with an optimal balance of safety performance cost and manufacturability 3rd Recognition Highlights a Continuous Technology RoadmapThis latest recognition represents a sustained evolution of ProLogiums technology roadmap Following its 2021 award for the Active Safety Mechanism ASM material ProLogium has continuously advanced both materials and cell architecture Between 2022 and 2024 ProLogium completed the synthesis and development of an ASMembedded allinorganic solidstate electrolyte From 2024 to 2025 it achieved a breakthrough in superfluidization technology enabling excellent interfacial contact and electrical performance without external pressure From ASM stabilizing cathode and anode active materials and eliminating flammable organic materials to resolving interfacial challenges significantly enhancing ionic conductivity to 56 times that of sulfide and liquid electrolytes and overcoming lowtemperature conductivity and manufacturability barriers this technology pathway is steadily advancing nextgeneration solidstate batteries from material innovation toward engineering validation and industrial deployment This progression also makes ProLogiums third Edison Award recognition more directly connected to its commercialization journey Three Key Breakthroughs in Gen 4 Technology with Verifiable Performance1 Interfacial stability and high conductivity without external pressureElectrolyte performance depends on both high ionic conductivity and high ionic transference number ProLogiums superfluidized allinorganic solidstate electrolyte achieves a nearunity transference number 100 comparable to solid sulfide electrolytes while delivering ionic conductivity of 57 mScm over 5x higher than conventional liquid and solid sulfide electrolytes 1012 mScm This outstanding performance is achieved without external pressure enabled by the nonNewtonian fluid behavior of superfluidized electrolyte In contrast to mainstream solid sulfide batteries that rely on substantial external pressure to sustain performance amp interfacial stability our ProLogiums Gen 4 technology operates effectively under pressurefree conditions By integrating the best attributes of liquid and solid systems ProLogium unlocks decisive advantages in energy density design flexibility and cost efficiency 2 High energy density fast charging and lowtemperature performance simultaneously achievedThe battery delivers 860 WhL volumetric energy density supports 6080 charge in 46 minutes and maintains 90 performance efficiency at 20C comparable to room temperature These metrics directly address the core electrification challenges of range charging efficiency and lowtemperature durability 3 Dualfunction electrolyte integrates safety and battery performanceA key differentiator of ProLogiums battery platform is its dualfunction electrolyte The material is intrinsically nonflammable and can release ASM in situ under high temperature and voltage conditions passivating cathode and anode active materials and eliminating thermal chain reactions to prevent thermal runaway This fundamental safety platform supports the use of highenergy density active materials delivering cell energy density of 860940 WhL without increasing risk of thermal runaway Balancing Safety Performance Cost and ManufacturabilityThe challenge of commercializing solidstate batteries lies not in maximizing a single parameter but in achieving multiple conditions simultaneously ProLogiums superfluidized allinorganic solidstate lithium ceramic battery integrates intrinsic and active safety combining a nonflammable electrolyte with ASM to eliminate the root causes of battery fires while supporting 94 highnickel cathode and 100 silicon anode Importantly this performance is not achieved through costly materials or complex processes The electrolyte contains no rare materials is recyclable and can be produced using industrialgrade 985 raw materials refined via superfluid processing to batterygrade 999 purity bringing BOM costs close to those of conventional liquid and organic electrolytes Manufacturing can also reduce 3040 of process steps and 6070 of dry room requirements lowering CAPEXOPEX and accelerating mass production readiness From EVs to Aerospace and Energy Storage Expanding the RealWorld Applications of Energy TransitionThis technology platform is now advancing into applications including electric vehicles energy storage and aerospace with further extensions to aircraft eVTOL maritime humanoid robots and largescale energy storage systems Its impact goes beyond improving individual product performance it addresses key industry challenges such as range anxiety lowtemperature degradation slow charging and thermal runaway risks By advancing safety durability and manufacturability simultaneously it enables faster deployment of lowcarbon solutions across transportation industry and energy systems Vincent Yang Founder and CEO of ProLogium statedWinning the Edison Award for the third time and receiving another Gold Award is a strong recognition of our longterm commitment to nextgeneration battery technology For us the value of innovation lies not only in advancing performance metrics but in building a reliable scalable and sustainable path to industrialization ProLogium will continue to develop safer more efficient and highly manufacturable technology platforms to support the global transition of transportation industry and energy systems CONTACT samprologiumcom
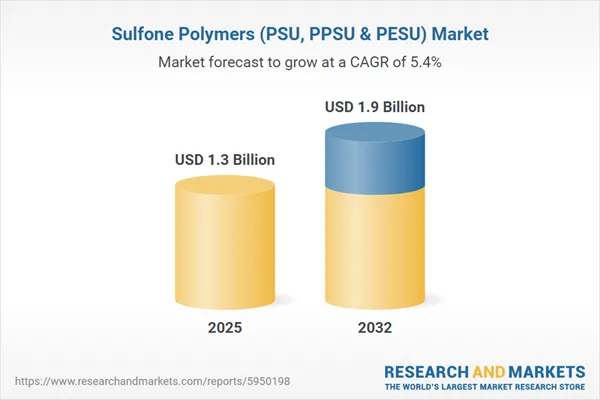
Sulfone Polymers (PSU, PPSU & PESU) Industry Report 2026 - PESU Emerges as Fastest-Growing Sulfone Polymer with 5.5% CAGR
Sulfone Polymers PSU PPSU amp PESU Market Sulfone Polymers PSU PPSU amp PESU Market Dublin April 23 2026 GLOBE NEWSWIRE The Sulfone Polymers PSU PPSU amp PESU A Global Market Overview has been added to ResearchAndMarketscoms offering By 2025 the global sulfone polymers market was valued at US13 billion stabilizing after previous pricing volatility The AsiaPacific region leads in demand driven by membrane manufacturing electronics and growing healthcare infrastructure with the United States following closely thanks to robust demand from medical water treatment and energytransition applications Polyethersulfone PESU is the frontrunner in product type with PSU following closely especially in membranegrade and medicalgrade materials The market is leaning towards applicationled highquality growth over pricedriven expansion By 2032 demand is projected to hit 96 thousand metric tons and US19 billion with value growth overtaking volume This is supported by rapidly expanding sectors such as medical amp healthcare automotive and electronics as well as water filtration and hydrogen systems Recent industry advancements like medicalgrade expansions chlorineresistant materials and certified circular products fortify this markets pivot towards highervalue applications Iran War Impact Ongoing geopolitical tensions involving Iran Israel and the US may disrupt supply chains for highperformance polymers reliant on petrochemical feedstocks These polymers made with bisphenol and aromatic sulfone intermediates depend heavily on energyintensive production processes vulnerable to crude oil price volatility and shipping route disruptions in the Middle East The 2026 outlook remains uncertain with analysts closely monitoring feedstock markets logistics and producer responses to evaluate pricing and supply implications Regional Market Analysis The AsiaPacific region dominated the sulfone polymers market by volume in 2025 with a 397 share attributed to strong demand from membrane electronics and expanding medical uses The United States ranked second reflecting stable demand from healthcare water treatment and emerging hydrogen applications Between 20252032 AsiaPacific also emerges as the fastestgrowing region expanding at a 54 CAGR reaching approximately 40 thousand metric tons by 2032 Product Type Analysis Polyethersulfone PESU dominated by volume with a 43 share largely due to membrane healthcare and hightemperature electronic applications Polysulfone PSU followed closely reflecting its wide usage in medical devices and water treatment PESU will continue its rapid expansion at a 55 CAGR through 2032 driven by demands for sterilizable and circular applications Enduse Application Analysis In 2025 the medical amp healthcare sector led the market with a 31 value share totaling US414 million driven by demand for dialysis membranes and highpurity healthcare applications Electrical amp electronics claimed the secondlargest segment with a 17 share During 20252032 water filtration emerges as the fastestgrowing segment at a 69 CAGR closely trailed by automotive Report Scope This global report on sulfone polymers PSU PPSU PESU examines the market by product type and enduse from 20222032 with projections from 20252032 in metric ton volume and value in US It profiles major companies and recent developments for a comprehensive industry overview Key Metrics Historical Period 20222025Base Year 2025Forecast Period 20252032Units Volume in Metric Tons Value in USCompanies Mentioned 23 BASF SEChangchun Jida Special Engineering Plastic Research Co LtdFuhai Dongying Advanced Materials Technology Co LtdGuangdong Youju Advanced New Materials Co LtdKingfa Science amp Technology Co LtdShandong Haoran Special Plastic Co LtdShanxi Huda Special Plastics New Material Technology Co LtdShenzhen Wote Advanced Materials Co LtdSumitomo Chemical Co LtdSyensqo SA Global Sulfone Polymers Market by Region United StatesEurope France Germany Italy UK othersAsiaPacific China Japan India South Korea othersRest of World Global Sulfone Polymers Market by Product Type Polysulfone PSUPolyphenylsulfone PPSUPolyethersulfone PESU Global Sulfone Polymers Market by Enduse Aerospace amp MilitaryAutomotiveBuilding amp ConstructionElectrical amp ElectronicsFood amp HouseholdMechanicalIndustrialMedical amp HealthcareOthers eg water filtration Key Attributes Report AttributeDetailsNo of Pages395Forecast Period20252032Estimated Market Value USD in 202513 BillionForecasted Market Value USD by 203219 BillionCompound Annual Growth Rate54Regions CoveredGlobal For more information about this report visit httpswwwresearchandmarketscomrkjz29b About ResearchAndMarketscomResearchAndMarketscom is the worlds leading source for international market research reports and market data We provide you with the latest data on international and regional markets key industries the top companies new products and the latest trends Attachment Sulfone Polymers PSU PPSU amp PESU Market CONTACT CONTACT ResearchAndMarketscom Laura WoodSenior Press Manager pressresearchandmarketscom For EST Office Hours Call 19173000470 For US CAN Toll Free Call 18005268630 For GMT Office Hours Call 35314168900

PyroGenesis Produces Battery-Grade Graphite from Carbon Black Using Proprietary Plasma System
Independent material testing shows batterygrade graphitization level of over 96MONTREAL April 23 2026 GLOBE NEWSWIRE PyroGenesis Inc PyroGenesis or the Company TSX PYR OTCQX PYRGF FRA 8PY1 a leader in ultrahigh temperature processes and engineering innovation and a plasmabased technology provider to heavy industry amp defense announces further to itspress release dated April 21 2026 the successful production of high quality batterygrade graphite from carbon black using a proprietary plasma process Of note the carbon black used to produce the graphite was itself produced by PyroGenesis in a firstever achievement where both a natural gaspowered and a methanepowered plasma torch acted as the sole feedstock ie the gas flowing through the torch to create plasma acts as the feedstock that is converted into carbon black With this process the plasma gas feedstock was directly converted into carbon black and hydrogen without the need for secondary raw material feedstock gases or additives The second step announced today converts the carbon black directly to graphite under high temperature provided by a plasma torch using an inert gas in an inert atmosphere The resulting graphite surpassed 96 graphitization as confirmed by an independent testing lab The full 2step system was designed by PyroGenesis on behalf of its client a Canadian company exploring alternative use of carbons for commercial applications and effectively produces graphite from a plasma torch with no additional feedstock or additives beyond the methane or natural gas used to create the plasma PyroGenesis has a 10 royalty on future gross revenues generated from the clients initial commercial graphite production plant and a 5 royalty on any subsequent plants In addition PyroGenesis is the exclusive plasma supplier and engineering service provider for the construction of any such plants As previously announced press release dated September 3 2024 this project began with a first phase contract valued at 1 million for the design and delivery of a customized pilotscale plasma reactor and associated testing infrastructure The successful results announced today confirm that the PyroGenesisdesigned plasmabased process produces graphite at an exceptionally high grade with a graphitization level of 96 Graphite for lithiumion battery anodes typically requires a graphitization level between 90 to 951methane or natural gas can be used as a combined plasma gas and feedstock to produce carbon black which can then be converted into graphite also using plasma with both materials meeting batterygrade standards PyroGenesis achievement in developing a new graphite production process has significant strategic importance due not only to the growing demand for graphite but also in securing the graphite supply chain domestically said Mr P Peter Pascali President and CEO of PyroGenesis The graphite industry is heavily dominated by China who controls 95 or more of the global batterygrade graphite supply2 This level of control amounts to a major vulnerability for North American manufacturers who need graphite especially highgrade graphite for use in batteries for EVs consumer electronics and large energy storage systems The research and engineering being conducted by our fastgrowing Materials Production vertical continues to underscore how local innovation using electric plasma as the primary technology can help solve many of the critical material and supply chain challenges facing both the heavy industry and manufacturing sectors Next Steps The next phase will focus on advancing towards a commercialscale system to produce highquality graphite INDUSTRY AND MARKET CONTEXT Graphite is valued for its unique combination of thermal conductivity electrical conductivity hightemperature resistance and lubricating properties making it a critical component in both modern technology sectors as well as for traditional manufacturing Graphite is used across a broad range of industrial applications including batteries refractories lubricants powdered metals brake linings and steelmaking with battery demand becoming an increasingly important growth driver The International Energy Agency reported that graphite demand rose by between 6 and 8 in 2024 mainly due to growth in electric vehicles battery storage renewables and grid infrastructure Grand View Research estimates the global graphite market at approximately US1329 billion in 2025 projected to grow to approximately US2387 billion by 20333 Graphite is recognized by the Government of Canada as a critical mineral4 About PyroGenesis Inc PyroGenesis leverages 35 years of plasma technology leadership to deliver advanced engineering solutions to energy propulsion destruction process heating emissions and materials development challenges across heavy industry and defense Its customers include global leaders in aluminum aerospace steel iron ore utilities environmental services military and government From its Montreal headquarters and local manufacturing facilities PyroGenesis engineers scientists and technicians drive innovation and commercialization of energy transition and ultrahigh temperature technology PyroGenesis operations are ISO 90012015 and AS9100D certified with ISO certification maintained since 1997 PyroGenesis shares trade on the TSX PYR OTCQX PYRGF and Frankfurt 8PY1 stock exchanges Cautionary and ForwardLooking Statements This press release contains forwardlooking information and forwardlooking statements collectively forwardlooking statements within the meaning of applicable securities laws In some cases but not necessarily in all cases forwardlooking statements can be identified by the use of forwardlooking terminology such as plans targets expects or does not expect is expected an opportunity exists is positioned estimates intends assumes anticipates or does not anticipate or believes or variations of such words and phrases or state that certain actions events or results may could would might will or will be taken occur or be achieved In addition any statements that refer to expectations projections or other characterizations of future events or circumstances contain forwardlooking statements Forwardlooking statements are not historical facts nor guarantees or assurances of future performance but instead represent managements current beliefs expectations estimates and projections regarding future events and operating performance Forwardlooking statements are necessarily based on a number of opinions assumptions and estimates that while considered reasonable by PyroGenesis as of the date of this release are subject to inherent uncertainties risks and changes in circumstances that may differ materially from those contemplated by the forwardlooking statements Important factors that could cause actual results to differ possibly materially from those indicated by the forwardlooking statements include but are not limited to the risk factors identified under Risk Factors in PyroGenesis latest annual information form and in other periodic filings that it has made and may make in the future with the securities commissions or similar regulatory authorities all of which are available under PyroGenesis profile on SEDAR at wwwsedarplusca These factors are not intended to represent a complete list of the factors that could affect PyroGenesis However such risk factors should be considered carefully There can be no assurance that such estimates and assumptions will prove to be correct You should not place undue reliance on forwardlooking statements which speak only as of the date of this release PyroGenesis undertakes no obligation to publicly update or revise any forwardlooking statement except as required by applicable securities laws Neither the Toronto Stock Exchange its Regulation Services Provider as that term is defined in the policies of the Toronto Stock Exchange nor the OTCQX Best Market accepts responsibility for the adequacy or accuracy of this press release For further information contact irpyrogenesiscom or visit httpwwwpyrogenesiscom 1 httpswwwthermofishercomblogmaterialshowtodeterminethedegreeofgraphitizationinbatteryanodes2 httpsenergystanfordedunewsconfrontingchinasgripgraphitebatteries3 httpswwwgrandviewresearchcomindustryanalysisgraphitemarketreport4 httpswwwcanadacaencampaigncriticalmineralsincanadacanadiancriticalmineralsstrategyhtmla3
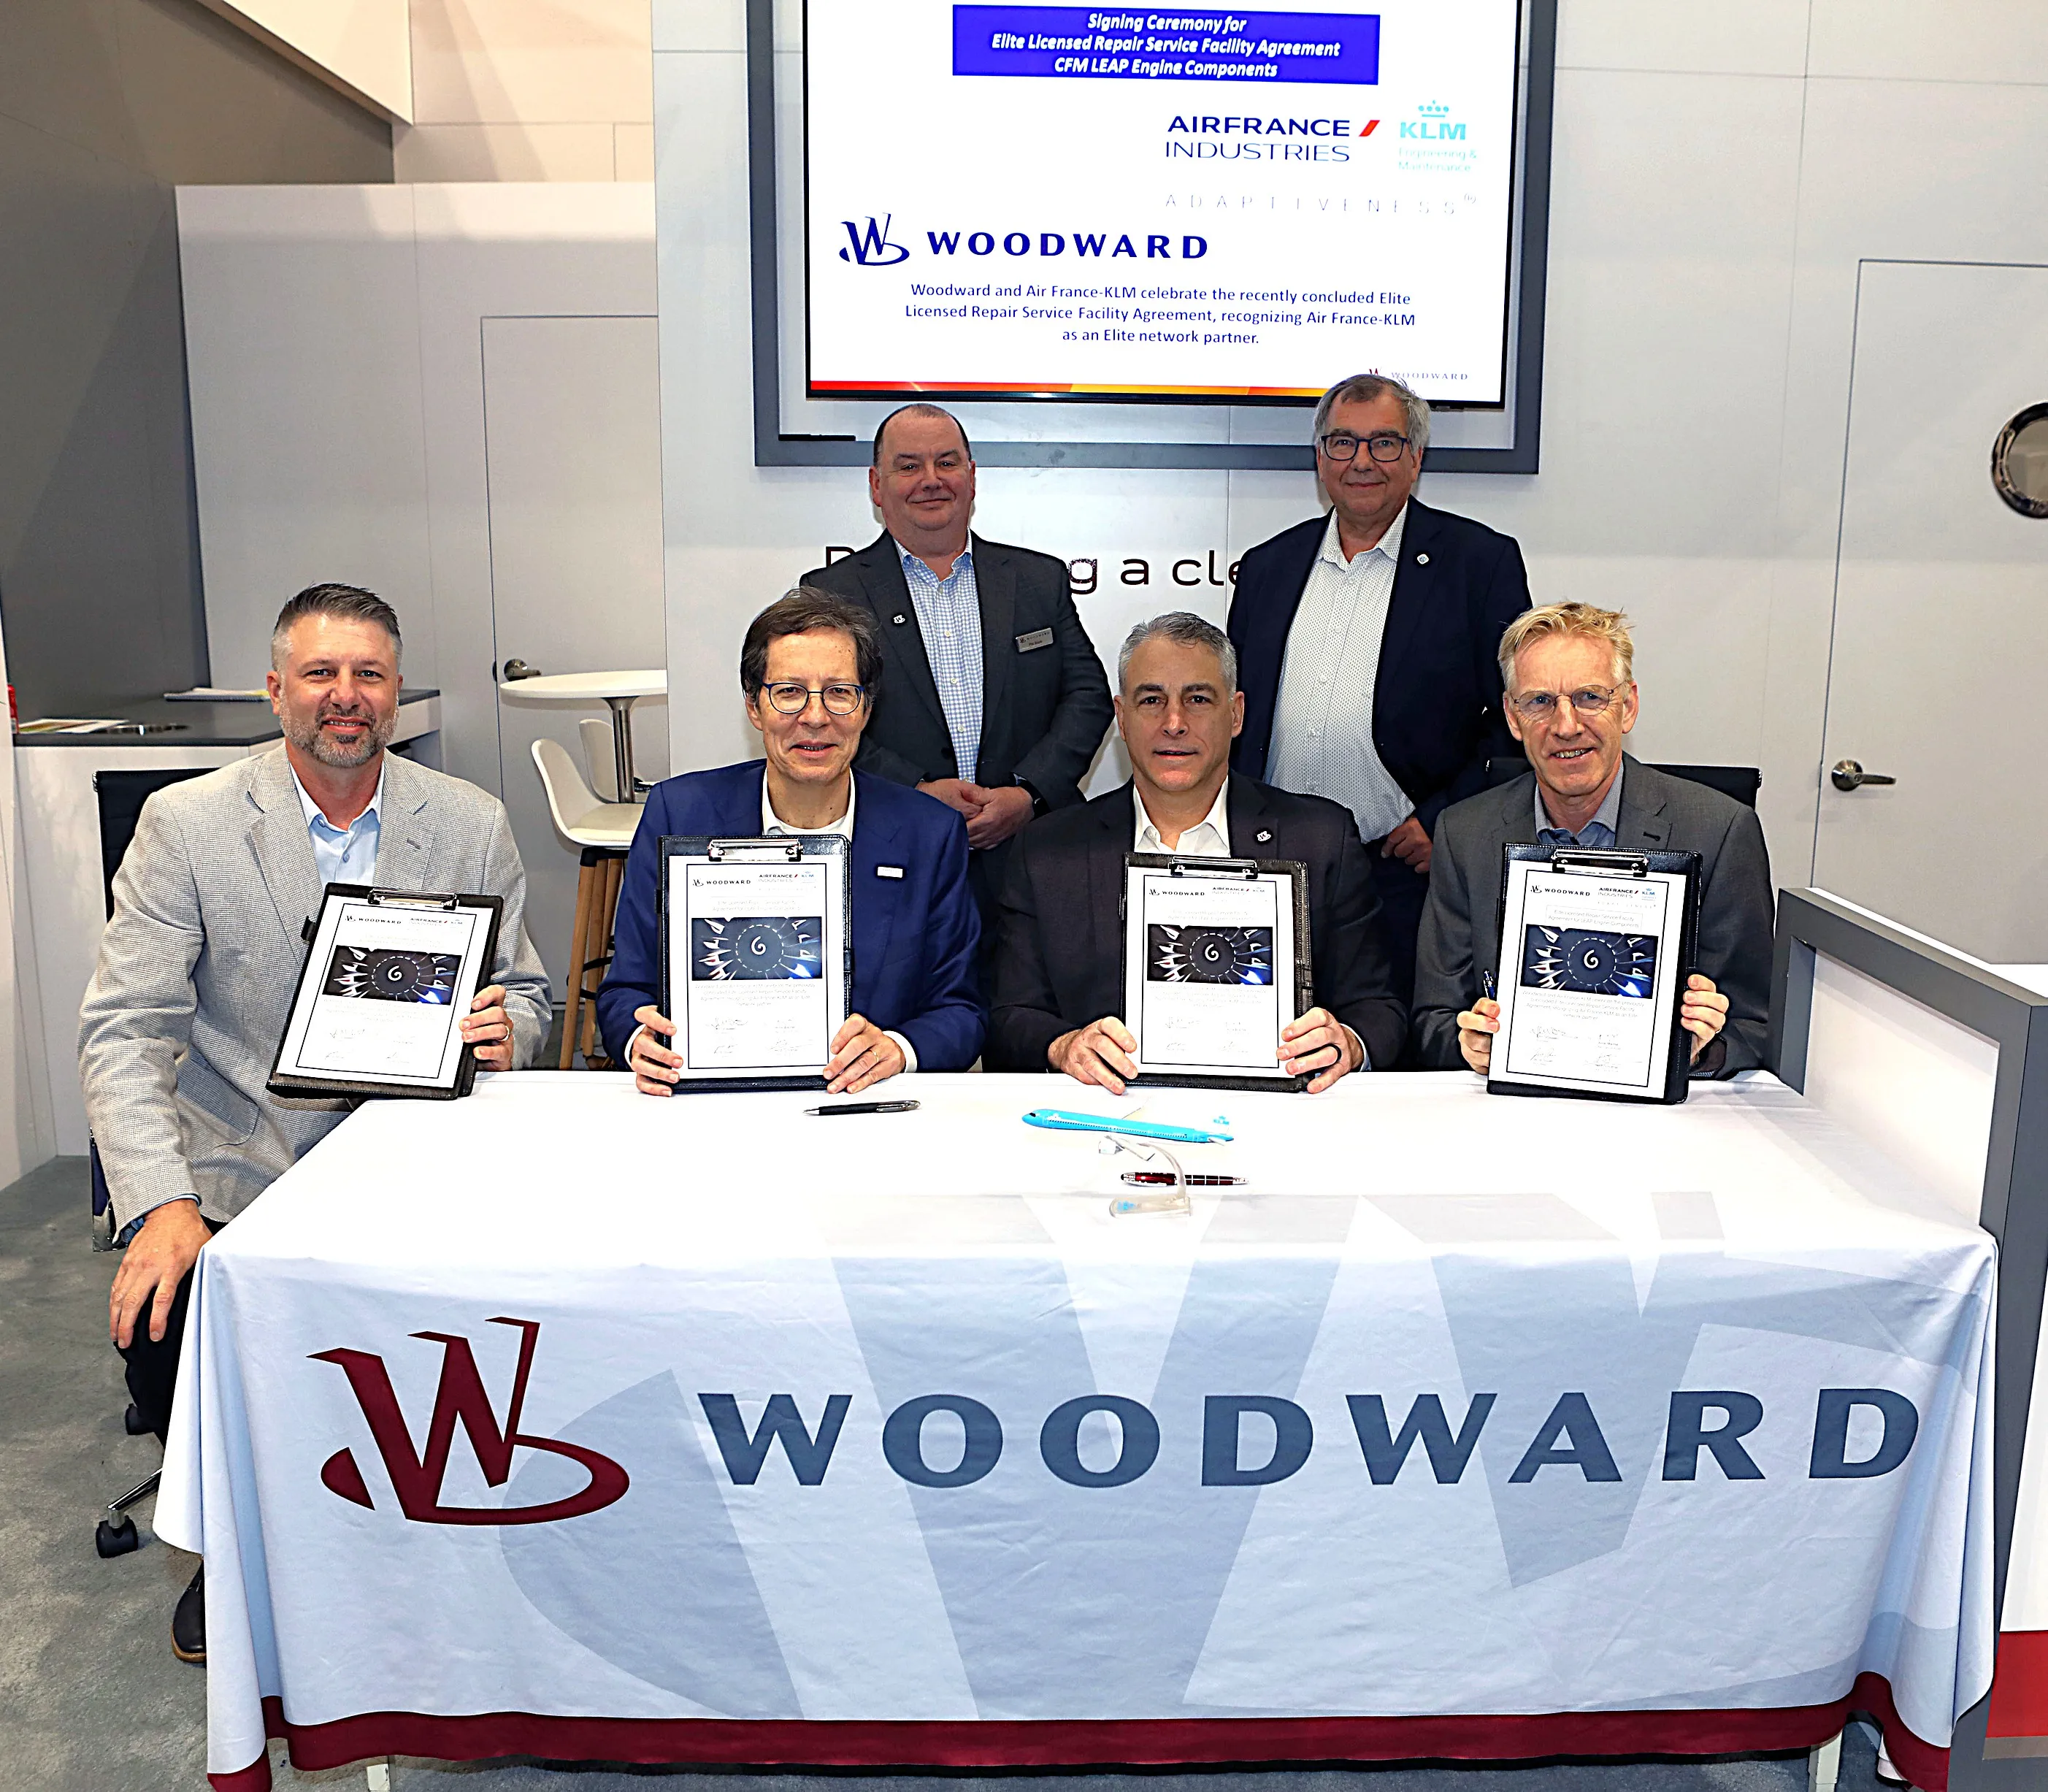
Woodward and AFI KLM E&M Announce Elite-Level Licensing Agreement for LEAP Engine MRO Services
PARIS and AMSTERDAM and FORT COLLINS Colo April 23 2026 GLOBE NEWSWIRE Air France Industries KLM Engineering amp Maintenance AFI KLM EampM has signed an Elite Licensed Repair Service Facility LRSF Agreement with Woodward to support the CFM International LEAP1A and LEAP1B engines Under this agreement AFI KLM EampM is now authorized to deliver a full suite of maintenance repair and overhaul MRO services for Woodward components across the CFM LEAP engine family This includes fuel controls actuators pumps and valvescritical systems ensuring optimal engine performance and reliability With a rapidly expanding global CFM LEAP engine fleet this agreement strengthens AFI KLM EampMs position as a CFM Premier MRO Provider making it a key player in nextgeneration engine support It also reinforces the Groups ability to meet increasing demand for highquality reliable and competitive MRO solutions worldwide For airline operators the partnership enhances access to certified repair capabilities for essential fuel system components contributing to improved turnaround times and operational efficiency By combining AFI KLM EampMs recognized expertise in engine maintenance with Woodwards advanced technologies the collaboration aims to maximize fleet availability while minimizing maintenancerelated disruptions This agreement marks an important milestone in expanding our LEAP engine support capabilities and further strengthening our collaboration with Woodward said Anne Brachet Executive Vice President Air FranceKLM EampM As the LEAP fleet continues to grow our priority is to provide our customers with reliable highperformance MRO solutions that ensure operational continuity and cost efficiency This partnership reinforces our commitment to delivering bestinclass support for nextgeneration engines This agreement reflects the start of a new chapter in our relationship with AFI KLM EampM and we are honored to add such a reputable provider of services to the Woodward Elite LRSF network said John DiSilvestro Senior Vice President of Sales Marketing and Service at Woodward With an evergrowing fleet of CFM LEAP engines having a trusted and experienced services provider like AFI KLM EampM is critical to ensuring seamless service delivery and customer satisfaction At MRO Americas left to right front to back Jacob Roush Vice President Sales and Marketing at Woodward JeanLouis Forest Senior Vice President Engine Product at Air France Industries KLM EampM Group John DiSilvestro Senior Vice President of Sales Marketing and Service at Woodward Huub Schotman Vice President Procurement at Air France Industries KLM EampM Group Phil Boyle Senior Sales Manager at Woodward Harmen Lanser Director Component Product Development at Air FranceKLM Engineering amp Maintenance About WoodwardWoodward is a global leader in the design manufacture and service of energy conversion and control solutions for the aerospace and industrial equipment markets The companys purpose is to design and deliver energy control solutions our partners count on to power a clean future Woodwards innovative fluid combustion electrical propulsion and motion control systems perform in some of the worlds harshest environments Woodward is a global company headquartered in Fort Collins Colorado USAwwwwoodwardcom About AFI KLM EampMAir France Industries KLM Engineering amp Maintenance is a major multiproduct MRO Maintenance Repair Overhaul provider With a workforce of over 13000 AFI KLM EampM offers comprehensive technical support for airlines ranging from engineering and line maintenance to engine overhaul aero structure and fan thrust reverser support as well as the management repair and supply of aircraft components structured around a powerful logistics network AFI KLM EampM supports almost 3000 aircraft operated by 200 major international and domestic airlineswwwafiklmemcom LEAP engines are a product of CFM International a 5050 joint company between GE Aerospace and Safran Aircraft Engines For more information please contact Air France Industries KLM Engineering amp MaintenanceCommunication Departmentmailpressafiklmemairfranceklmcom Jennifer ReginaWoodward Communications 1 970 559 8840jenniferreginawoodwardcom A photo accompanying this announcement is available at httpswwwglobenewswirecomNewsRoomAttachmentNgf0618b73a6bd4a0695d7875546d63004

CSG to Supply Long-Range Artillery Ammunition Worth Almost EUR 250 Million to a European Customer
The global industrialtechnology group CSG will carry out another significant project for the supply of largecalibre ammunition Based on financing provided by a Western European country it will deliver 155 mm longrange artillery ammunition used as standard by NATO armies to a European customer The value of the project amounts to nearly EUR 250 million approximately CZK 6 billion Deliveries are expected to take place over a period of ten months This new contract marks another step in CSGs strategic shift toward longrange largecaliber ammunition and highlights the Groups strong position not only in Western European markets CSG continuously responds to market developments and systematically expands its production capacities and technologies to meet growing demand for both standard ammunition types and advanced longrange solutions The importance of extendedrange artillery ammunition has been increasing significantly in recent years driven by the evolving nature of modern conflicts and growing requirements from armed forces to engage targets at greater distances while maintaining high accuracy and effectiveness In this context CSG expects a continued shift in demand toward longrange ammunition and is already well positioned to address this trend This contract is another confirmation of our strategy in longrange ammunition and clearly demonstrates CSGs ability to deliver largescale projects in highly competitive Western European markets CSG is focused on the future needs of armed forces worldwide and is continuously adapting its production to the growing demand for ammunition with extended range said Jan Marinov CEO of CSG Defence Systems Due to the sensitive nature of the project CSG will not disclose further details about the customer or the specific scope of deliveries CSG sees the increasing emphasis on the ability to strike targets at greater distances as a key factor shaping the future development of artillery ammunition Modern conflicts and the requirements of armed forces confirm that extended range is essential for both operational effectiveness and safety CSG is among the leading European manufacturers and suppliers of largecaliber ammunition The current EUR 250 million contract follows several other major agreements the Group has secured in this segment since the beginning of the year underscoring its ability to respond to growing demand from armed forces At the same time it represents another step in executing CSGs strategy focused on longrange ammunition and further strengthens its position as one of the key players in this segment About CSG CSG NV CSG is a Dutch company and a leading European defence industrial group with its top management headquartered in Prague Czech Republic CSG develops and delivers defence and industrial technologies that contribute to a safer and more stable future The Group focuses on the development and manufacturing of strategically important products systems and technologies in the fields of defence and ammunition as well as in related sectors such as aerospace CSG operates key manufacturing facilities in the United States the United Kingdom Spain Italy Germany the Czech Republic Slovakia Serbia and India and exports its products worldwide The Group continues to invest in the growth of its portfolio companies and the expansion of its core business activities Key companies within the Group include Excalibur Army Czech Republic land systems Tatra Trucks Czech Republic vehicles MSM Group Slovakia artillery ammunition and The Kinetic Group United States smallcalibre ammunition CSG employs more than 14000 people across its integrated and affiliated companies In 2025 the Group reported annual revenues of EUR 67 billion CSG shares are traded on Euronext Amsterdam under the ticker CSG More information is available at wwwczechoslovakgroupcom Press Service CSGAndrej rtek spokesmantel 420 602 494 208 Email andrejcirtekczechoslovakgroupcz Attachments PRCSG to Supply LongRange Artillery Ammunition Worth Almost EUR 250 Million to a European Customer PRCSG to Supply LongRange Artillery Ammunition Worth Almost EUR 250 Million to a European Customer
Eramet: strong turnover momentum in Q1 2026 driven by a solid operational performance
Paris 23 April 2026 730 am PRESS RELEASE Eramet strong turnover momentum in Q1 2026 driven by a solid operational performance Strong quarterly improvement in the Group accident frequency rate however with a fatal accident to report in JanuaryAdjusted turnover1 of 840m up 13 versus Q1 2025 Positive volumemix effect 15 notably driven by an increase in sales of manganese ore 10 and nickel ore 54 with a less favourable mix compared to lower comparatives in Q1 2025Positive price effect 7 but more than offset by an unfavourable currency effect 9 Solid operational performance in rail transport in Gabon 16 in transported ore volumes while progressing on the railway renovationContinued rampup in lithium production at Centenario with a nameplate capacity of close to 80 on average in March in line with the targets Gradual and partial restart of installations in Senegal from endApril thanks to the strong mobilisation of Eramet Grande Cte EGC teams following the fire in FebruaryRequest for an upward permit revision currently being submitted by PT Weda Bay Nickel PT WBN following the approval of an initial RKAB limited to 12 Mwmt of nickel ore for 2026 which production will be achieved by midMay the mine is preparing to be placed on Care and Maintenance in May pending this revisionFavourable price environment over the quarter particularly for manganese ore 8 for the CIF China 44 price index and lithium gt2x for the batterygrade lithium carbonate price index in ChinaProgress on the funding plan Initial impact of the ReSolution programme notably with productivity and purchasing gains posted over the quarter Waiver2 unanimously obtained from the banking pool on the June and December 2026 gearing covenantValidation by the Board of Directors of the resolutions to be submitted to shareholders at the AGM of 27 May enabling the rollout of a 500m capital increase in H2 2026 Uncertain economic environment particularly linked to the war in the Middle East with an inflationary effect on prices selling prices and input costs including energy and freight 2026 targets Transported manganese ore confirmed between 64 and 68 Mt with a FOB cash cost3 still between 24 and 26dmtu4 Nickel ore sold externally limited to 9 Mwmt on the basis of the initial 12 Mwmt RKAB with a request for an upward revision currently being submitted target achieved in midApril while the remainder of production is dedicated to production continuity at the Joint Ventures NPI production plant Lithium carbonate produced confirmed between 17 and 20 ktLCE with a nameplate capacity close to 100 at end2026Mineral Sands suspended pending a more accurate assessment of the solutions under review and the schedule to restart production at the EGC site the Group expects to communicate on its HMC5 production target within the coming weeks Controlled capex confirmed between 250m and 290m6 in 2026 down 30 to 40 vs 2025 Christel Bories Eramet group Chair and CEOThis first quarter confirmed the Groups ability to adapt and mobilise to meet its targets despite the uncertainties Our turnover significantly increased driven by the rampup in our Lithium activity in Argentina and the rise in volumes of transported manganese ore in Gabon The favourable price momentum was largely offset by the fall in the US dollar and rising input costs Thanks to our robust technology and a successful rampup our worldclass lithium asset in Argentina started to contribute to our results In Senegal in two months our teams succeeded in managing the effects of the fire that broke out at our mineral sands extraction unit and in providing a technical solution enabling the start of a gradual and partial restart of installations from endApril Parallel to this with the support of our reference shareholders we made progress in executing our funding plan notably by submitting the necessary resolutions for a vote on a capital increase at our next General Meeting We are also working closely with the Board of Directors to appoint a new Chief Executive Officer as soon as possible In a disrupted macroeconomic environment our teams are fully mobilised and focused on our priorities safety operational performance and cash management I am confident in the momentum we have gained and our ability to overcome our challenges by leveraging our exceptional mining assets Plan to enhance cash generation and strengthen the balance sheet With the support of its Board of Directors Eramet implemented a comprehensive funding plan in February aimed at improving cash generation and strengthening the balance sheet This plan is built on three pillars and aims to gradually enable the normalisation of the Groups credit ratios gearing and leverage while securing its liquidity and access to the bond market In the medium term this enhanced financial flexibility will enable Eramet to seize new growth opportunities Performance improvement and cash generation The solid operational performance of rail transport in Gabon 16 in rail transported ore volumes vs Q1 2025 is the result of efforts to secure operations and investments to debottleneck transport capacity which are ongoing Overall productivity gains and cost reductions were posted under the ReSolution programme Capex reduction is under control Strategic review of assets with monetisation options Eramet launched a strategic review of its portfolio seeking to monetise targeted assets which could materialise in agreements signed with strategic partners by end2026 Several options are under consideration particularly minority stakes in some of the Groups business activities Planned equity base strengthening At the time of publishing its 2025 annual results in February the Group announced its intention to strengthen its equity base by around 500m in 2026 The representatives of the reference shareholders approved this plan at the Board of Directors meeting on 18 February 2026 and committed to vote in favour of the resolutions necessary for its implementation These resolutions were published in the Universal Registration Document URD and approved by the Board of Directors on 2 April 2026 These resolutions will be voted on at an Annual General Meeting scheduled for 27 May In particular these include an authorisation granted to the Board of Directors to increase the Companys share capital by issuing ordinary shares while maintaining shareholders preemptive subscription rights up to a maximum amount of 500m This transaction is planned in H2 once the necessary preparations are completed and subject to market conditions at the time of its launch In this context discussions may be held with potential investors who could participate in the planned capital increase and help to support the Groups longterm growth In addition as part of discussions with its banking pool Eramet unanimously obtained from its lenders in respect with of the RCF Revolving Credit Facility and the Term Loan a waiver on the June and December 2026 gearing covenants confirming lenders confidence in the execution of the funding plan CSR commitments Safety The Groups safety performance was mixed in Q1 2026 The TRIFR7 was 03 at the Group level vs 06 in Q1 2025 remaining significantly below the limit set in the CSR roadmap for 2026 lt10 Two major accidents occurred over the period Eramet mourns a fatal accident that occurred on 22 January at PT WBN during a maintenance operation The Group immediately implemented targeted action plans in collaboration with the majority partner of the Indonesian Joint Venture JVOn 22 February a fire broke out in a Wet Concentration Plant WCP8 at the EGC site No casualties or injuries were reported Decarbonisation Until 2025 Eramet based its climate targets on the ScienceBased Targets initiative SBTi framework 2026 saw the Group achieve a further milestone by publishing an Alternative Decarbonization Framework in its URD in collaboration with the I Care consultancy firm This Framework is tailored to the specific characteristics of the mining and metals industry reviewed by several leading organisations and can be accessed via the Groups website9 This framework which now represents the benchmark for assessing the Groups targets against the Paris Agreement scenarios is intended to be shared across the entire industry On this basis Eramet published new decarbonisation targets a 42 reduction in Scope 1 amp 2 emissions by 2035 versus 2023 aligned with a 15C trajectory for the Group excluding SLN10 Societal In Senegal since the temporary suspension of its activities and in line with its societal commitments as validated by its IRMA 50 score EGC has continued to engage in regular dialogue with local stakeholders with the support of existing consultation bodies to closely monitor the situation and its impact on the local area Against this background priority community initiatives are being continued in an effort to minimise the economic and social impact on the affected communities Extrafinancial rating Eramets ISS ESG rating was upgraded to B in March versus C previously placing the Group in the first decile of mining industry companies In early 2026 EcoVadis also increased its rating to 73100 compared to 68100 in its previous assessment Eramet group adjusted turnover by activity Millions of euros1Q12026Q1 2025Chg1 mChg5 Manganese46445772Manganese ore activity23 271250218Manganese alloys activity2 193207 157Adjusted Nickel excluding SLN21631144943Share of PT WBN 387 excluding offtake contract116734359 Weda Bay trading activity offtake contract 4741615Mineral Sands3968 2942Lithium57057naHolding and eliminations41171041312Eramet group adjusted28407429813 1 Data rounded to the nearest million 2 See definition in Appendix 73 Turnover linked to external sales of manganese ore only including 17m linked to Setrag transport activity other than Comilogs ore in Q1 2026 17m in Q1 20254 Mainly includes turnover from the sale of SLNs ferronickel since it is booked under Eramet SA SLNs turnover linked to the sale of nickel ore and others was excluded from the figures presented5 Data rounded to higher or lower NB 1 all the commented figures for Q1 2026 and Q1 2025 correspond to figures as presented in the Groups consolidated financial statements unless otherwise specified NB 2 all the commented changes in Q1 2026 are calculated with respect to Q1 2025 unless otherwise specified NB 3 mentions of Q1 Q2 Q3 and Q4 refer to the four quarters of the financial year mentions of H1 and H2 refer to the two halfyears The Groups adjusted turnover1 amounted to 840m in Q1 2026 up 13 versus Q1 2025 22 at constant scope11 and exchange rates with 9 of currency effect This increase reflects a positive price effect combined with a favourable volume effect for all activities except for mineral sands which were penalised by volumes sold against a backdrop of declining prices Manganese In Q1 2026 the solid mining and rail performance in Gabon enabled the transportation of 16 Mt of manganese ore 16 vs Q1 2025 Turnover of the Manganese activities was 464m 2 for the period Ore turnover up 8 driven by rising volumes sold externally and a higher average selling price 8 notably driven by the increase in sea freight but offset by an unfavourable currency effect 11Alloys turnover down 7 penalised by an unfavourable mix and currency effect which was partly offset by the increase in volume sold Manganese oreQ1 2026Q1 2025Chg ChgTurnover m1271250218Manganese ore and sinter transportation Mt 16140216External manganese ore sales Mt 14120110FOB cash cost2 excl export duties dmtu2524015Manganese alloysQ1 2026Q1 2025Chg Chg Turnover m193207157Alloys sales kt 15814996 ow refined alloys 49534 pts8 1 Turnover linked to external sales of manganese ore only including 17m linked to Setrag transport activity other than Comilogs ore vs 17m in Q1 20252 Definition updated see financial glossary in Appendix 7 now excluding mining taxes and royalties noncontrollable which account for 6 of FOB turnover Market trends12 amp prices13 Global production of carbon steel the main endproduct for manganese was 473 Mt in Q1 2026 down by 2 from Q1 2025 China which accounts for more than half of global steel production was down by nearly 4 Conversely India continued to see an increase in production 9 which was also the case in North America 3 benefitting from the protectionist measures introduced Europe posted a further decline of 3 faced with continued declining demand and continuing pressure from imports Manganese ore consumption for Q1 2026 reached 51 MtMn up 2 yearonyear reflecting rising demand from India In parallel manganese ore production increased by 13 to 53 MtMn with limited growth for highgrade ore Production from South Africa which still accounts for nearly 50 of seaborne production continued to post record levels 22 Gabon also saw volumes up by 4 in line with the increase in shipments from Comilog over the quarter As a result the manganese ore supplydemand balance was in surplus in Q1 2026 with a more balanced scenario for highgrade vs semicarbonated ore Chinese port ore inventories rose to 52 Mt at endMarch vs 46 Mt at endDecember 2025 representing the equivalent of around 10 weeks of consumption The price index CRU for manganese ore CIF China 44 averaged 50dmtu in Q1 2026 up 8 vs Q1 2025 11 vs Q4 2025 boosted by demand that remained strong among manganese alloys producers and mounting pressure on freight costs since early 2026 The price index CRU for refined alloys in Europe MC Ferromanganese averaged 1523t up 2 14 vs Q4 2025 driven by a temporary rise in prices following the introduction of the CBAM Carbon Border Adjustment Mechanism in Europe The price index for standard alloys Silicomanganese averaged 1126t up 4 11 vs Q4 2025 bolstered by the formal adoption of safeguard measures by the European Union EU However US prices are an exception continuing to face competitive pressure from Indian imports affecting both standard and refined alloys Activities In Gabon mining and rail activities delivered a solid performance in Q1 2026 compared to a Q1 2025 disrupted by logistics challenges at the port of Owendo The strong operational performance of Setrag enabled the transportation of 16 Mt of ore over the quarter 16 vs Q1 2025 This momentum observed both for Comilog flows and for other railway users reflects tangible progress in terms of safety traffic and maintenance Works to modernise the Transgabonese railway are also actively ongoing Production is aligned at 16 Mt 11 vs Q1 2025 Volumes sold externally totalled 14 Mt over the quarter 10 vs Q1 2025 The FOB cash cost3 for manganese ore activity averaged 25dmtu over the quarter up 5 from Q1 2025 reflecting an unfavourable currency effect which was partly offset by rising volumes Mining taxes and royalties came out to 02dmtu stable from Q1 2025 Sea transport costs per tonne were significantly up to 09dmtu 15 reflecting the recent increase in freight and fuel rates in connection with the geopolitical situation in the Middle East Manganese alloys production slightly increased to 168 kt 4 Parallel to this manganese alloys sales were up 6 to 158 kt with an unfavourable mix notably reflecting the increased volumes of commodities sold in the United States and the rest of the world Outlook Global carbon steel production is expected to moderately increase in 2026 with a less significant decline in Chinese production than in 2025 offset by an increase for the rest of the world particularly in India where Eramet has a strong business footprint As a result demand for manganese ore should slightly increase in 2026 driven by growth in alloys production in India and the rest of the world while demand in China is set to remain under pressure Subject to fuel availability supply is also expected to remain higher in 2026 than in 2025 driven by continued strong production in South Africa and normalised production levels in Australia The market consensus is still set around 50dmtu14 on average for 2026 representing an increase of close to 10 in the manganese ore price index CIF China 44 compared with 2025 As disclosed at the end of February transported ore volumes are set to be between 64 Mt and 68 Mt in 2026 The FOB cash cost3 is still expected to be between 24 and 26dmtu with the favourable impact of increased volumes versus 2025 largely offset by an unfavourable currency effect15 Manganese alloys sales are expected to increase over the year The activitys cost base should be impacted from endQ2 by the recent rise in manganese ore and freight prices in connection with geopolitical tensions in the Middle East These cost increases were reflected in the manganese alloys margin with a lag of around 3 months factoring in the management of inventories and supplies Nickel In Q1 2026 external sales for nickel ore in Indonesia reached 83 Mwmt up 54 from Q1 2025 which was penalised by the destocking of the plants at the Indonesia Weda Bay Industrial Park IWIP ending 2024 with high inventories Adjusted turnover1 for the Nickel activity was 163m 43 over the period The share of turnover for PT WBN excluding the offtake contract was up 59 reflecting higher volumes as well as sales prices which were driven by the LME London Metal Exchange and the high level of ore premiums resulting from the limited supply in the Halmahera region The volumes of nickel ferroalloys sold offtake contract on PT WBN plant production were near stable Nickel oreQ1 2026Q1 2025Chg Chg PT WBN 3871 share of turnover m116734359Nickel ore external sales 100 Mwmt83542954 ow Saprolite Mwmt48381027 ow Limonite Mwmt361619118Nickel ferroalloysQ1 2026Q1 2025Chg Chg Offtake turnover m4741615NPI production 100 kt9091011NPI sales 43 offtake kt 3839012 1 Excluding nickel ferroalloys offtake Market trends16 amp prices Global stainlesssteel production which is the largest endmarket for nickel increased by nearly 4 to 157 Mt in Q1 2026 versus Q1 2025 Production in China which accounts for more than 60 of the global supply saw growth of nearly 5 still driven by exports and domestic consumption Global demand for primary nickel rose 3 to 09 MtNi supported by demand for stainlesssteel 65 of current demand with moderate growth of 2 against a background of production increasingly directed towards lowernickelcontent grades Demand for batteries posted a more sustained increase of 7 as did other applications notably driven by the energy and aerospace industries At the same time global primary nickel production was down 3 to 09 MtNi resulting from the combined impact of a significant decline in NPI production17 in China 19 the decrease in traditional ferronickel production 4 and a marginal decline in the production of NPI and nickel intermediates in Indonesia 1 and 2 reflecting pressures on local nickel ore supply caused by mining quota restrictions However the supplydemand balance class I and II18 remained in slight surplus for the quarter Visible nickel inventories at the LME and SHFE19 amounted to 347 ktNi at endMarch vs 301 kt at endDecember equivalent to around 5 weeks of consumption In Q1 2026 the LME price average price of class I nickel was 17362t up 12 17 vs Q4 2025 reflecting the current uncertainty surrounding Indonesian ore supply The average for the NPI price index20 class II nickel as sold at Weda Bay also increased by 12 18 vs Q4 2025 averaging 13446t In Indonesia the market price for nickel ore was reflected in the SMM 16 CIF which factors in both the regulatory price floor HPM Nickel21 and the premium applied to the latter In Q1 2026 this index was 62wmt up 32 yearonyear and 18 from Q4 2025 This increase reflects the combined effect of a rising HPM to 30wmt for 16 saprolite22 ie a 13 increase from Q4 2025 in line with rising nickel prices on the LME and premiums that remained high over the quarter exceeding 100 of the HPM for saprolite in a context of domestic nickel ore supply that remained under pressure Limonite prices also trended upwards Activities Over the period in Indonesia PT WBN obtained an initial RKAB for an annual production and sales volume of 12 Mwmt in nickel ore in 2026 of which 3 Mwmt was sold internally This permit represents a decrease of more than 70 versus the RKAB for 2025 32 Mwmt initially granted then revised upwards to 42 Mwmt in July of the same year In Q1 2026 external ore sales23 totalled 83 Mwmt 54 vs Q1 2025 External saprolite sales totalled 48 Mwmt up 27 with Q1 2025 volumes penalised by destocking in the plants in the IWIP Indonesia Weda Bay Industrial Park at the start of the year The average nickel grade for the quarter was 15 vs 16 in Q1 2025 Limonite sales accounted for 36 Mwmt up significantly 22x and propelled by growing demand from the IWIP HPAL HighPressure Acid Leach plants Internal consumption for the NPI plant represented 10 Mwmt over the quarter PT WBN continued to benefit from significant premiums more than 100 over the quarter vs the HPM Nickel Index for its highgrade saprolite selling prices against the background of domestic supply restrictions As expected production costs at the mine considerably increased yearonyear given the increase in the strip ratio and rising energy prices the effects of which began to materialise in March Production at the NPI plant amounted to 90 ktNi over the quarter 1 vs Q1 2025 As part of the offtake contract trading activity NPI sales stood at 38 ktNi 2 vs Q1 2025 Outlook Primary nickel demand is expected to increase in 2026 driven in particular by stainless steel production in China and India as well as nickel consumption in other enduse sectors However uncertainties remain around the growth in nickel supply given the limitation of mining permits in Indonesia as well as sulphur supply difficulties and rising sulphur prices affecting HPAL plants The nickel market started the 2026 financial year in surplus but could gradually rebalance For 2026 the market consensus for LME nickel prices currently stands at around 16700tNi14 up around 10 vs 2025 and could be revised upward depending on how the situation evolves In Indonesia a request for an upward revision of the initial RKAB obtained for 2026 is currently being submitted with the relevant authorities24 This request has been initiated through the usual process and is consistent with the mines production capacity and the levels authorised in previous years While supporting the Indonesian authorities policy intended to achieve a sustainable rebalancing of the nickel market PT WBN aims to better meet the growing demand from the IWIP industrial park with its ore needs estimated at more than 100 Mwmt per year remaining significantly above the volumes currently authorised Pending the approval of this revision and to meet its legal requirements PT WBN will place its operations in Care and Maintenance in May Consequently the Joint Venture JV will suspend its commercial operations with IWIP PT WBNs NPI plant meanwhile will continue to operate as normal using its ore stocks PT WBN will make every effort to limit the social impact of these adaptations and support local communities throughout this period working closely with local authorities its subcontractors customers and other stakeholders As previously disclosed production costs per tonne of ore are expected to increase compared to 2025 subject to authorised volumes and mining plan adjustment costs as well as the significant rise in fuel prices which directly impacts costs for its mining subcontractors Moreover the Indonesian government has recently revised the formula used to calculate the reference price for nickel ore HPM with changes taking effect in midApril In addition to nickel content the new formula now factors in the value of other metals contained in the ore such as cobalt This reform reflects the countrys authorities ambition to better reflect the actual economic value of the nickel ore and to apply royalties based on a higher price The impacts of the revised HPM formula vary depending on the type of nickel ore For saprolite the impact on net price should be limited the rise in the HPM is expected to be offset by a downward adjustment in market premiums leading to an overall stable net price For limonite with a lower nickel grade and intended for HPAL plants the new formula results in a substantial increase in the HPM reference price eg limonite composed of 12 nickel and 01 cobalt content increases from the HPM reference around 17wmt to more than 40wmt with the new formula Mineral Sands Following the fire that broke out on 22 February 2026 at Eramet Grande Ctes mineral sands extraction unit operations at the site were gradually shut down in early April as remaining stocks of heavy minerals concentrate were exhausted As a result produced mineral sand volumes declined by 49 and sales were limited over the quarter The Mineral Sands activity turnover decreased by 42 to 39m in Q1 2026 penalised by the decrease in volumes sold in a context of declining prices Mineral SandsQ1 2026Q1 2025ChgChg Turnover m39682942Mineral Sands production kt12123611549Ilmenite sales kt 941263226Zircon sales kt 161729 Market trends amp prices25 Global demand for zircon was slightly down yearonyear Macroeconomic uncertainty and the ongoing weakness in real estate activity around the world particularly in China continue to weigh on demand for ceramics which was partly offset by sustained demand from the chemicals and refractories industries Parallel to this global supply declined as a result of production adjustments made by the sectors key players serving to stabilise prices over the quarter As a result zircon premium prices stood at 1500t FOB in Q1 2026 down 17 from the same period last year but stable versus Q4 2025 Despite stable yearonyear global demand for TiO2 pigments26 the endmarket for titaniumbased mineral products27 TiO2 pigment production appears to be declining owing to a slight destocking mainly in China driving ilmenite demand downwards Production cuts by the major players in response to falling demand were offset by the rampup of new projects and concentrates imported into China which did not enable the market to be brought back into balance The market price for ilmenite chloride as produced by EGC was 257t FOB in Q1 2026 down 10 due to sluggish demand Activities In Senegal following the fire that broke out in February in the Wet Concentration Plant WCP28 where heavy minerals are separated from the mineral bearing sands HMC5 production was immediately suspended Downstream operations at the site however continued until stocks of HMC5 and finished products were exhausted in early April As a result mineral sands production volumes were limited to 121 ktHMC 49 vs Q1 2025 Similarly ilmenite and zircon production volumes decreased ending at 121 kt 7 and 12 kt 29 respectively Q1 2026 sales were impacted less through the use of HMC5 inventories and readily accessible finished products Ilmenite volumes sold totalled 94 kt 26 vs Q1 2025 with some loading postponed to Q2 while zircon sales reached 16 kt 9 During the fire the swift response of internal teams in coordination with firefighters from neighbouring localities contained the damage to the upstream screening process EGC also took swift action to limit the financial impact The production shutdown automatically reduced variable costs which account for only a small proportion of the sites cost structure Measures were also undertaken to reduce fixed costs and preserve cash for the duration of the operational shutdown Outlook Demand for zircon and ilmenite is expected at best to recover only slightly in 2026 Rising energy prices could affect ceramics production while a resurgence in inflation and subdued growth would reduce demand for TiO2 pigments Some of the demand for ceramics and pigments from the Middle East could also be paused in the short term Zircon production cuts and reductions implemented in late 2025 could enable an average price increase in 2026 versus the previous year In parallel ilmenite supply would remain in surplus resulting in lower average price levels in 2026 compared to 2025 In Senegal local teams have been fully mobilised and are working with the Groups support on temporary solutions to feed the WCP exclusively using the Supplementary Dry Mining Unit SDM29 These solutions will enable a gradual and partial restart of installations from endApril The Group is also continuing to assess the impact of the incident and the requisite repair work with a view to expeditiously resuming operations Aligning with its social commitments as demonstrated by its IRMA 50 score achieved in February 2026 EGC has continually engaged in active dialogue with stakeholders across the board trade union representatives national and local authorities host communities etc As such the Senegalese subsidiary decided to go beyond its required legal scope introducing temporary layoff arrangements for all affected employees supported by a scheme ensuring that their full health cover is maintained as well as a temporary adjustment to their compensation EGC is also maintaining all channels of dialogue with local communities and is committed to continuing its priority community initiatives Pending a more accurate assessment of production capacity expected for 2026 the Group continues to suspend its guidance regarding Mineral Sands production Investments planned to finalise the increase in production capacity and support the decarbonisation of operations were committed at the start of the year The final tranche of around 30m will mostly be sustained in 2026 since most of the work was already initiated by contract prior to the fire The Group will communicate on its production guidance and the financial impacts of this fire for 2026 within the coming weeks Lithium In Argentina in Centenario the rampup in lithium production at the Direct Lithium Extraction DLE plant was successfully continued in Q1 2026 reaching a nameplate capacity of close to 80 on average in March Turnover for the Lithium activity was 57m for the period reflecting increased sales volumes in a context of high prices LithiumQ1 2026Q1 2025ChgChg Turnover m57057nmLithium carbonate production tLCE37204403280nmLithium carbonate sales tLCE3920403880nm Market trends amp prices30 In Q1 2026 global electric vehicle EV sales posted a mixed performance depending on the region with a slight decline estimated around 8 versus Q1 2025 China and the United States weighed on the overall performance reporting a decline of 21 and 27 respectively These declines were partly offset by robust momentum in Europe 20 and emerging Asian markets 40 Installations of stationary energy storage systems ESS considerably increased in Q1 2026 51 driving cell production Consequently demand for lithium was significantly up over the quarter reaching 444 ktLCE 42 vs Q1 2025 Parallel to this lithium supply amounted to 443 ktLCE 26 vs Q1 2025 mainly driven by established players in Australia and Chile as well as rising production in Argentina at the same time as the rampup in new spodumene mines in Mali and also Australia In China lepidolite mines remained constrained by mining permit compliance and the related environmental requirements while growth in production was fuelled by brine and recently commissioned spodumene mines The SMM batterygrade index China averaged 19663tLCE in Q1 2026 up 110 The index rose by 81 in Q1 from Q4 2025 reflecting strong growth in demand and a tighter supplydemand balance at the start of the year Activities In Argentina the Centenario plant continued the rampup in its lithium carbonate production according to the planned schedule During Q1 2026 production averaged a level close to 80 of the nameplate capacity in January and March In February operations were impacted by a limitation in gas supply to feed the plant as well as by a planned extended shutdown to successfully improve the design of one of the downstream pieces of equipment enabling the rampup process to continue Lithium carbonate production volumes totalled 3720 tLCE in Q1 2026 As stated previously considering the priority given to ramping up production Eramet has decided to produce only limited quantities of battery grade This approach remains cost effective given the related cost savings Volumes sold amounted to 3920 tLCE primarily intended for CAM producers in China Outlook Growth in demand for lithium is expected to continue being driven by the ongoing adoption of electric vehicles worldwide particularly in China where the penetration rate is forecast to reach 60 by 2026 and in Europe where the 30 threshold is expected to be met Growth in demand for lithium is also expected to be driven by the widescale deployment of ESS While China remains the market leader growth is diversifying geographically with Europe and North America gaining significant ground The robust development of this technology is expected to boost demand for LFP chemical cathodes which now dominate the world over In terms of supply global production is expected to turn around in 2026 propelled by the rampup of Australian players and the development of new projects in Africa However this recovery is still not enough to fully cater to the growth in demand As a result the market remains pressured particularly as supply risks persist notably the suspension of exports from Zimbabwe and regulatory constraints weighing on some Chinese mines The market consensus batterygrade CIF Asia lithium carbonate currently averages around 18550tLCE14 in 2026 up close to 95 vs 2025 Rampup at the Centenario plant is progressing as planned with the objective of reaching close to 100 capacity by the end of 2026 24 ktLCE per year As a result lithium carbonate production volume guidance for the year remains in the 1720 ktLCE range Eramet continues to assess future development growth options for Centenario with the salars overall production potential based on the 15 MtLCE of estimated resources for the salar The Group is currently conducting studies of various growth scenarios including in the first instance a brownfield expansion at its current DLE plant leveraging a derisked technology and benefitting from existing additional capacity which would enable lower capital intensity and a cash cost already positioned in the first quartile Eramet is also assessing potential targeted strategic projects and partnerships in the lithium sector that would allow the Group to capitalise on its nowdemonstrated track record in brine production its processing knowhow its proprietary DLE technology and its expertise in salar geology and project development This growth strategy which does not require substantial shortterm investments is in line with the Groups priority to pursue a deleveraging path while once more unlocking positive cash generation Outlook The outbreak of the Middle Eastern conflict in late February 2026 was the main unforeseen shock at the start of the year disrupting trade flows through the Strait of Hormuz The effects of this conflict on global value chains are not yet fully visible meaning that the macroeconomic impacts could take time to materialise with a lag and highly mixed regional performances The International Monetary Fund IMF initiated a downgrade its global growth forecast to 31 for 2026 from 33 previously warning of the risk of a sustained resurgence in inflation The average price consensus31 and exchange rate32 for 2026 currently stand at around 50dmtu for manganese ore CIF China 44 c16700t for LME nickelc18550tLCE for lithium carbonate batterygrade CIF Asia 119 for the exchange rate As a reminder in early January the Group had exceptionally set up a hedge on its EURUSD exposure The latter concerns around half of its annual exposure33 at endMarch with a rate of 120 Manganese alloys selling prices are still expected to face high volatility in 2026 Market prices for nickel ore in Indonesia should continue to trend positively supported by both high nickel prices and high premiums on the HPM in a context of persistent tension on domestic ore supply Sensitivities of adjusted EBITDA11 to the price of metals to the fuel and to the exchange rate are presented in Appendix 5 In 2026 sea freight rates are expected to be at levels higher than in 2025 with increased volatility Energy costs are expected to rise particularly for fuel oil driven by geopolitical tensions although alloy production sites which are highly electricityintensive benefit from electricity cost hedging The cost of reductants is expected to increase slightly over the year Guidance 2026 targets ActivitiesIndicators1802202623042026ManganeseTransported volumes64 68 MtConfirmedFOB12 cash cost24 26dmtuConfirmedAlloys salesStable vs 2025ConfirmedNickel oreExternal volumes sold Mwmt Notification received to submit an initial RKAB for 12 Mwmt of which 9 Mwmt for external sales with the intention to request an upward revision as early as possibleLimited to 9 Mwmt on the basis of the initial 12 Mwmt RKAB with a request for an upward revision currently being submittedMineral SandsHMC productiongt 900 ktHMCSuspended pending a more accurate assessment of the solutions under review and the schedule to restart production at the EGC site LithiumProduced volumes17 20 ktLCEConfirmed 1 Definitions in the financial glossary in Appendix 7 2 For an exchange rate of 119 The capex amount6 is expected to be between 250m and 290m in 2026 CapexActivity2026 guidance1802202623042026SustainingGroup150m 190mConfirmedDebottleneckingGroup owAround 100mConfirmedManganese Improvement of logistics chain in GabonAround 70mConfirmedMineral Sands Completion of production capacity expansion project and decarbonisation of operationsAround 30mConfirmed Calendar 23042026 Shareholders General Meeting 29072026 Publication of 2026 halfyear results 29102026 Publication of 2026 Group thirdquarter turnover ABOUT ERAMET Eramet transforms the Earths mineral resources to provide sustainable and responsible solutions to the growth of the industry and to the challenges of the energy transition Its employees are committed to this through their civic and contributory approach in all the countries where the mining and metallurgical group is present Manganese nickel mineral sands and lithium Eramet recovers and develops metals that are essential to the construction of a more sustainable world As a privileged partner of its industrial clients the Group contributes to making robust and resistant infrastructures and constructions more efficient means of mobility safer health tools and more efficient telecommunications devices Fully committed to the era of metals Eramets ambition is to become a reference for the responsible transformation of the Earths mineral resources for living well together wwwerametcom INVESTOR CONTACTDirector of Investor RelationsSandrine NourryDabiT 33 1 45 38 37 02 sandrinenourrydabierametcomPRESS CONTACTMedia Relations OfficerNedjma AmraniT 33 6 65 65 44 49nedjmaamranierametcom Appendix 1 Reconciliation tables Millions of eurosQ1 2026Q1 2025Chg mChg Turnover published financial statements732688436Share of PT WBN 387 excluding offtake contract116734359Adjusted turnover8487618611Turnover excluded from SLN18191156Adjusted turnover excluding SLN28407429813 1 Turnover linked to the sale of nickel ore and others turnover from the sale of SLNs ferronickel which is booked under Eramet SA2 Definition in the financial glossary in Appendix 7 Appendix 2 Quarterly turnover Millions of euros1Q1 2026Q42025Q3 2025Q2 2025Q1 2025Manganese464474421492457 Manganese ore activity2271264221275250 Manganese alloys activity2193210200217207Adjusted Nickel163245142117114Mineral Sands 3955516768Lithium5730740Holding elim and others311710598105104Eramet group adjusted840907720786742SLN turnover48791319Eramet group published financial statements732708641716688 1 Data rounded to the nearest million2 See definition in the financial glossary in Appendix 73 Mainly includes turnover from the sale of SLNs ferronickel since it is booked under Eramet SA SLNs turnover linked to the sale of nickel ore and others was excluded from the figures presented4 SLNs turnover linked to the sale of nickel ore and others Appendix 3 Productions and shipments Q1 2026Q4 2025Q3 2025Q2 2025Q1 2025Chg Q1 2026 Q1 2025ManganeseManganese ore and sinter production Mt1595168018741764178511Manganese ore and sinter transportation Mt1608151715861659138616External manganese ore sales Mt1359157212451432124010Manganese alloys production kt1681571741601624Manganese alloys sales kt1581741561611496NickelMarketable nickel ore production PT WBN 100 basis kwmt 1004213303123237080916910Nickel ore external sales PT WBN 100 basis kwmt83401823492715639539954 ow Saprolite kwmt47621090762434574375727 ow Limonite kwmt35797327302810651642118Nickel ferroalloys production PT WBN 100 basis ktNi content90949479911Nickel ferroalloys sales NPI PT WBN Eramet offtake 43 ktNi content38444135392Mineral SandsMineral Sands production kt12125423925323649Ilmenite production kt1211681451741307Zircon production kt121917191629Ilmenite sales kt9417711516612626Zircon sales kt16151716179LithiumLithium carbonate production ktLCE372039002080 270 440745 Lithium carbonate sales ktLCE392039001000 480 40nm Appendix 4 Price and index Q1 2026Q4 2025Q12025Chg Q1 2026 Q1 2025Chg Q1 2026 Q4 2025ManganeseMn CIF China 44 dmtu1502453464811Ferromanganese MC Europe t1152313301487214Silicomanganese Europe t1112610141087411NickelNi LME t21736214879155691217Ni LME lb27886757061217SMM NPI Index t31344611381119631218SMM CIF 1635 Ni wmt46252473218HPM5 Nickel prices 1635 wmt3026271013Mineral SandsZircon t61 5001 5001800 170Chloride ilmenite t7 257 262 287 10 2LithiumLithium carbonate batterygrade China t LCE81966310877934911081Exchange rateEURUSD 9117116105111 1 Quarterly average market prices based on monthly Index CRU prices Eramet calculation and analysis2 LME London Metal Exchange prices3 SMM NPI 1012 index effective January 2026 formerly SMM NPI 812 abandoned end2025 The SMM index was adjusted to reflect the current structure of the nickel market which is dominated by highgrade Indonesian NPI gt10 this change does not materially impact prices as the transactions covered by the two indices are virtually equivalent4 Market price index for Indonesian ore with a 16 grade and 35 moisture content including the HPM price floor and the premium level above it5 Official index for domestic nickel ore prices in Indonesia6 Market and Eramet analysis premium zircon7 Market and Eramet analysis8 SMM Shanghai Metals Market Lithium carbonate batterygrade Delivered to Client China spot price excl VAT9 Bloomberg HPM calculation formula in Indonesia Since 15 April 2026 the formula to calculate the nickel ore reference price HPM was updated by the Indonesian government through the countrys Ministry of Energy and Mineral Resources Decree Kepmen ESDM No 1442026 The new formula now incorporates the value of other metals contained in the ore iron cobalt chromium in addition to nickel content and is calculated as follows HPM Nickel Ore Floor Price Ni CFNi HMA Nickel Ore Reference Price Ni Fe CFFe HMAFe Co CFCo HMACo Cr CFCr HMACr 1 MC Moisture Content The Indonesian government developed a website where the HPM can be calculated directly via the following link using the below parameters HPM calculator HPM nickel ore floor price FOB derived from the Indonesian term Harga Patokan MineralNi Fe Co Cr nickel iron cobalt and chromium contentCFNi CFFe CFCo CFCr applicable correction factors factors for adjustment CFNi 30 1 for every 01 of nickel grade vs the reference of 16CFFe 30CFCo 30CFCh 10 HMA nickel ore reference price derived from the Indonesian term Harga Mineral Acuan equivalent to the average spot price of nickel iron cobalt and chromium on the LME with a lag expressed in tonne of nickel and published twice a month at the following link HMA MC nickel moisture content The previous HPM calculation formula remained in force until 15 April 2026 See previous press releases available on the Groups website Appendix 5 Sensitivities of Group adjusted EBITDA SensitivitiesChangeAdjusted EBITDA impact1Manganese ore prices CIF China 441dmtuc210mManganese alloys prices100tc55mNickel ore prices HPM Nickel Weda Bay10wmtc70mLithium prices lithium carbonate batterygrade CIF Asia1000tLCEc15mFuel prices10bblc15mExchange rate201c60m 1 For an exchange rate of 1192 Sensitivity calculated factoring in the EuroUSD currency hedge set up in 2026 Appendix 6 Socit Le Nickel SLN Q1 2026Q4 2025Q3 2025Q2 2025Q1 2025Nickel ore production kwmt632762809694700Nickel ore external sales kwmt7354116169230Ferronickel production ktNi content9396928887Ferronickel sales ktNi content9498899382Ni ore CIF China 18 wmt1902792797813750 1 CNFEOL China FerroAlloy Online Other mining countries In New Caledonia SLNs mining production amounted to 06 Mwmt in Q1 2026 down 10 yearonyear SLNs mining activity remains heavily impacted by the closure of certain mining sites on the East Coast SLNs nickel ore exports also remained constrained in Q1 2026 at 01 Mwmt down 68 versus the same period last year In Q1 2026 nickel ore prices 18 CIF China as exported by SLN averaged 90wmt increasing by 20 from Q1 2025 Ferronickel production increased to 93 ktNi 7 vs Q1 2025 Volumes sold were also up at 94 ktNi 14 vs Q1 2025 Cash cost9 of ferronickel production averaged 82lb in Q1 2026 vs78lb in Q1 2025 This deterioration is attributable to an unfavourable change in inventories and a negative currency effect These impacts were partly offset by a favourable volume effect The spot price of ferronickel as produced by SLN class II nickel decreased by 7 yearonyear Appendix 7 Financial glossary Consolidated performance indicators The consolidated performance indicators used for the financial reporting of the Groups results and economic performance and presented in this document are restated data from the Groups reporting and are monitored by the Executive Committee Turnover at constant scope and exchange rates Turnover at constant scope and exchange rates corresponds to turnover adjusted for the impact of the changes in scope and the fluctuations in the exchange rate from one financial year to the next The scope effect is calculated as follows for the companies acquired during the financial year by eliminating the turnover for the current period and for the companies acquired during the previous period by integrating in the previous period the fullyear turnover for the companies sold by eliminating the turnover during the period considered and during the previous comparable period The exchange rate effect is calculated by applying the exchange rates of the previous financial year to the turnover for the year under review Adjusted turnover excluding SLN Adjusted turnover is presented to provide a better understanding of the underlying operational performance of the Groups activities Adjusted turnover corresponds to turnover including Eramets share of the turnover of significant joint ventures accounted for using the equity method in the Groups financial statements restated for the offtake of all or part of the business activity As of 31 March 2026 turnover was adjusted to include the contribution of PT Weda Bay Nickel a company in which Eramet owns a 387 indirect interest Eramet owns a 43 interest in Strand Minerals Pte Ltd the holding which owns 90 of PT Weda Bay Nickel and is booked in the Groups consolidated financial statements under the equity method An offtake agreement for nickel ferroalloys production NPI is in place with Tsingshan with Eramet holding a 43 interest and Tsingshan 57 Adjusted turnover also excludes turnover linked to the sales of nickel ore and others from SLN as a standalone company given that the entitys losses have been fully financed by the French State since 2024 following an agreement signed with Eramet However turnover linked to ferronickel trading is still booked in the adjusted turnover under Holding given the existence of a purchase agreement between SLN and Eramet SA and a sales agreement between Eramet SA and end customers A reconciliation with Group turnover is provided in Note 5 to the Groups consolidated financial statements Manganese ore activity Manganese ore activity corresponds to Comilogs mining activities excluding the activity of the Moanda Metallurgical Complex CMM which produces manganese alloys and Setrags transport activities Manganese alloys activity Manganese alloys activity corresponds to the plants that transform manganese ore into manganese alloys It includes the three Norwegian plants comprising Eramet Norway ENO ie Porsgrunn Sauda and Kvinesdal Eramet Marietta EMI in the United States Comilog Dunkerque CDK in France and the Moanda Metallurgical Complex CMM in Gabon Manganese ore FOB cash cost new definition The FOB Free On Board cash cost of manganese ore is defined as all production and overhead costs RampD including exploration geology administrative expenses sales expenses overland transport expenses which cover all stages of ore extraction through to shipping to the port of shipment and loading and which impact the EBITDA in the Companys financial statements over tonnage sold for a given period This cash cost does not include sea transport or marketing costs and now also does not include the mining taxes and royalties from which the Gabonese State benefits ExWorks cash cost for lithium carbonate The ExWorks cash cost for lithium carbonate produced by Eramine is defined as all the production and structure costs covering the entire extraction and refining stages required to make the finished or final product upon leaving the plant and which have an impact on EBITDA in the Companys financial statements over tonnage sold for a given period This cash cost does not include land and sea transport costs mining taxes and royalties from which the Argentine State benefits or marketing costs SLNs cash cost SLNs cash cost is defined as all production and overhead costs RampD including exploration geology administrative expenses logistical and commercial expenses net of byproducts credits including exports and nickel ore and local services which cover all the stages of industrial development of the finished product until delivery to the end customer and which impact the EBITDA in the Companys financial statements over tonnage sold Appendix 8 Footnotes 1 Definitions for adjusted turnover are presented in the financial glossary in Appendix 72 For the RCF amp Term Loan3 See financial glossary in Appendix 7 Cash cost calculated excluding noncontrollable costs sea transport marketing costs mining taxes and royalties4 Based on a consensus USD rate of 119 for 20265 Heavy Mineral Concentrate 6 Excluding the capex of SLN financed by the French State7 TRIFR Total Recordable Injury Frequency Rate FR2 Frequency rate of accidents at work of Eramet employees temporary staff and subcontractors fatal Lost Time Injury LTI NonLost Time Injury NLTI expressed as the number of accidents per million hours worked8 Wet Concentration Plant9 I Care Alternative 15C Decarbonization Framework for Diversified Mining amp Metals10 And on a well below 2C trajectory for SLN factoring in the specific constraints of New Caledonia11 See financial glossary in Appendix 712 Unless otherwise indicated market data corresponds to Eramet estimates based on World Steel Association production data13 Unless otherwise indicated price data corresponds to the average for market prices Eramet calculations and analysis manganese ore price index CRU CIF China 44 spot price manganese alloys price indices CRU Western Europe spot price14 As of April 202615 119 according to Bloomberg for 2026 in early April vs 113 in 202516 Unless otherwise indicated market data corresponds to Eramet estimates17 Nickel Pig Iron NPI18 Class I produced with a nickel content above or equal to 99 Class II produced with a nickel content below 9919 LME London Metal Exchange SHFE Shanghai Futures Exchange20 SMM NPI 1012 index effective January 2026 formerly SMM NPI 812 abandoned end2025 The SMM index was adjusted to reflect the current structure of the nickel market which is dominated by highgrade Indonesian NPI gt10 this change does not materially impact prices as the transactions covered by the two indices are almost equivalent21 FOB monthly price floor as established by the government and indexed to the LME nickel price see Appendix 422 For nickel ore with 35 moisture content Indonesian prices are set according to domestic market conditions but with a monthly price floor based on the LME in compliance with a government regulation published in April 202023 At the plants on the industrial park other than the NPI JV plant24 ESDM Kementerian Energi dan Sumber Daya Mineral Ministry of Energy and Mineral Resources25 Unless otherwise indicated price data corresponds to the average for market prices Eramet calculations and analysis Source Zircon premium FOB prices Market and Eramet analysis Source Chloride ilmenite FOB prices Market and Eramet analysis 26 c90 of titaniumbased endproducts27 Titanium dioxide slag ilmenite leucoxene and rutile28 Wet Concentration Plant29 Supplementary Dry Mining Unit30 Unless otherwise indicated price data corresponds to the average for market prices Eramet calculations and analysis Lithium carbonate price index SMM batterygrade spot price delivered to client China 31 Eramet analysis based on a panel of the main sellside and market analysts32 Bloomberg forecast consensus in early April for 202633 At endMarch 2026 the hedge ratio was estimated at around 50 of annual exposure which may vary significantly depending on changes in volumes and prices throughout the year Attachment 2025 04 23 Eramet PR Q1 2026 EN VF

Rocket Lab Completes Second Dedicated Launch for Japan Aerospace Exploration Agency (JAXA)
MAHIA New Zealand April 23 2026 GLOBE NEWSWIRE Rocket Lab Corporation Nasdaq RKLB Rocket Lab or the Company a global leader in launch services and space systems today successfully launched its second dedicated mission for the Japan Aerospace Exploration Agency JAXA further strengthening the partnership between Rocket Lab and Japans national space agency The Kakushin Rising mission lifted off from Rocket Lab Launch Complex 1 in New Zealand at 309 pm NZT to successfully deploy eight spacecraft for JAXAs Innovative Satellite Technology Demonstration Program that included educational small sats an oceanmonitoring satellite a demonstration satellite for ultrasmall multispectral cameras and a deployable antenna packed tightly using origami folding techniques that can unfurl up to 25 times its size Kakushin Rising builds on the success of Rocket Labs first dedicated launch for JAXA that took place in December 2025 which saw Electron deploy the RAISE4 spacecraft that demonstrated new aerospace technologies developed by several companies universities and research institutions throughout Japan As with that first mission Rocket Lab worked closely with JAXA on Kakushin Rising to ensure the mission requirements for each satellite were met with precision and efficiency reaffirming Electrons reputation for reliability and mission success Rocket Lab founder and CEO Sir Peter Beck said Two successful missions in a matter of months deployed precisely where they needed to be on orbit shows exactly why Electron is the preferred small launcher for national space agencies JAXA is a world leader in space and its been an honor to be trusted with these backtoback missions growing Japans aerospace economy Kakushin Rising was Rocket Labs 8th launch of the year and 87th launch overall Upcoming launches in 2026 include missions for commercial Earth observation new space technology demonstrations on orbit and national security and defense Kakushin Rising launch images F87 Kakushin Rising Flickr Kakushin Rising launch webcast Rocket Lab Kakushin Rising Launch YouTube Rocket Lab Media ContactMurielle Bakermediarocketlabusacom About Rocket LabAbout Rocket Lab Rocket Lab is a leading space company that provides launch services spacecraft payloads and satellite components serving commercial government and national security markets Rocket Labs Electron rocket is the worlds most frequently launched orbital small rocket its HASTE rocket provides hypersonic test launch capability for the US government and allied nations and its Neutron launch vehicle in development will unlock medium launch for constellation deployment national security and exploration missions Rocket Labs spacecraft and satellite components have enabled more than 1700 missions spanning commercial defense and national security missions including GPS constellations and exploration missions to the Moon Mars and Venus Rocket Lab is a publicly listed company on the Nasdaq stock exchange RKLB Learn more at wwwrocketlabcorpcom Forward Looking StatementsThis press release contains forwardlooking statements within the meaning of the Private Securities Litigation Reform Act of 1995 We intend such forwardlooking statements to be covered by the safe harbor provisions for forwardlooking statements contained in Section 27A of the Securities Act of 1933 as amended the Securities Act and Section 21E of the Securities Exchange Act of 1934 as amended the Exchange Act All statements contained in this press release other than statements of historical fact including without limitation statements regarding our launch and space systems operations launch schedule and window safe and repeatable access to space Neutron development operational expansion and business strategy are forwardlooking statements The words believe may will estimate potential continue anticipate intend expect strategy future could would project plan target and similar expressions are intended to identify forwardlooking statements though not all forwardlooking statements use these words or expressions These statements are neither promises nor guarantees but involve known and unknown risks uncertainties and other important factors that may cause our actual results performance or achievements to be materially different from any future results performance or achievements expressed or implied by the forwardlooking statements including but not limited to the factors risks and uncertainties included in our Annual Report on Form 10K for the fiscal year ended December 31 2025 as such factors may be updated from time to time in our other filings with the Securities and Exchange Commission the SEC accessible on the SECs website atwwwsecgovand the Investor Relations section of our website athttpsinvestorsrocketlabcorpcomwhich could cause our actual results to differ materially from those indicated by the forwardlooking statements made in this press release Any such forwardlooking statements represent managements estimates as of the date of this press release While we may elect to update such forwardlooking statements at some point in the future we disclaim any obligation to do so even if subsequent events cause our views to change

Global Tunable Diode Laser Spectrometers Market Size/Share Worth USD 2.14 Billion by 2035 at a 8.8% CAGR: Custom Market Insights (Analysis, Outlook, Leaders, Report, Trends, Forecast, Segmentation, Growth Rate, SWOT Analysis)
220 Pages Latest Report According to a market research study published by Custom Market Insights the demand analysis of Global Tunable Diode Laser Spectrometers Market size share revenue was valued at approximately USD 084 Billion in 2025 and is expected to reach USD 092 Billion in 2026 and is expected to reach around USD 214 Billion by 2035 at a CAGR of 88 between 2026 and 2035 The key market players listed in the report with their sales revenues and strategies are ABB Ltd Analytical Instruments Division Siemens AG Process Analytics EndressHauser Group Yokogawa Electric Corporation Emerson Electric Co Rosemount Analytical Picarro Inc Los Gatos Research PolyScience NEO Monitors AS Axetris AG Cascade Technologies Ltd Emerson MettlerToledo International Inc and othersAustin TX USA April 22 2026 GLOBE NEWSWIRE Custom Market Insights has published a new research report titled Tunable Diode Laser Spectrometers Market Size Trends and Insights By Product Type Tunable Diode Laser Absorption Spectroscopy TDLAS Analyzers SinglePass MultiPass CavityEnhanced TDLAS CRDS OAICOS CEAS Wavelength Modulation Spectroscopy WMS Systems Frequency Modulation Spectroscopy FMS Systems Other Product Types Photoacoustic Laser Spectroscopy DualComb Spectroscopy By Technology NearInfrared NIR TDLAS 780 nm2500 nm TelecomGrade DFB Lasers MidInfrared MIR TDLAS 25 m20 m QCL ICL Other Technologies FarInfrared Terahertz Laser Spectroscopy By Application Gas Concentration Measurement O CO CO CH HO NH HCl HF HS Isotope Ratio Analysis C D O CC Process Gas Analysis Reaction Monitoring Feed Gas Purity Product Gas Quality Combustion Monitoring Oxygen Trim Excess Air Control Flue Gas Analysis Environmental amp Atmospheric Monitoring Trace Gas Greenhouse Gas Air Quality Other Applications Breath Analysis Leak Detection Food Quality By EndUse Industry Oil amp Gas Upstream Midstream Downstream LNG Chemical amp Petrochemical Power Generation Coal Gas Nuclear Biomass Environmental Monitoring Regulatory Research Urban Air Quality Pharmaceutical amp Life Sciences Semiconductor Manufacturing Food amp Beverage Headspace Analysis Modified Atmosphere Packaging Other Industries Metals amp Mining Cement Glass Pulp amp Paper and By Region Global Industry Overview Statistical Data Competitive Analysis Share Outlook and Forecast 2026 2035 in its research database According to the latest research study the demand of the global Tunable Diode Laser Spectrometers Market size amp share was valued at approximately USD 084 Billion in 2025 and is expected to reach USD 092 Billion in 2026 and is expected to reach a value of around USD 214 Billion by 2035 at a compound annual growth rate CAGR of about 88 during the forecast period 2026 to 2035 Click Here to Access a Free Sample Report of the Global Tunable Diode Laser Spectrometers Market httpswwwcustommarketinsightscomrequestforfreesamplereportid82534 Tunable Diode Laser Spectrometers Market Revenue and Trends The tunable diode laser spectrometers market is a global market that includes advanced gas analyzers that use tunable diode laser technology TDLAS to detect and quantify various gases O NH CO CO HO HS and CH in realtime and noncontact in a harsh environment and without the need to extract the sample or condition it to a specific temperature a feature not observed in other techniques such as the Fourier Transform Spectrophotometer Global tunable diode laser spectrometer market is very dynamic with a high rate of growth through the tightening of environmental and emission monitoring policies and the increasing need to optimize processes and ensure safety at the workplace the fast industrialization of heavy industries such as oil and gas and power generation and digital integration around the globe Request a Customized Copy ofthe Tunable Diode Laser Spectrometers MarketReport httpswwwcustommarketinsightscomrequestforcustomizationreportid82534 What are the Factors That Have a Significant Contribution to the Growth of the tunable diode laser spectrometers market Adoption has increased in response to decarbonization requirements imposed globally ultralowemission levels enforced in the power and refining industries and continuous monitoring required in applications where safety is critically important The oil and gas and power generation industries have been accredited with high uptake of these spectrometers as reported by industries to detect traces and perform predictive maintenance at trace levels With the escalating environmental concern and enhanced industrial safety measures operators want low maintenance nonintrusive solutions that will provide high selectivity and rapid response times regardless of dusty environments corrosion and even hightemperature applications Technological advances have brought designs of foldedpath probes that do not require any alignment multicomponent simultaneous measurement AIenhanced signal processing and integration with DCSPLC systems that are easy to deploy enhance reliability and accuracy and simplify the deployment Other motivations are increased attention to hydrogen blending initiatives ammonia slip control in SCRs and sour gas detection lower cost due to enhanced production of laser diodes and governmental regulation and industry investments in emission control and intelligent production in the developed and emerging markets A free sample of the Tunable Diode Laser Spectrometers report is available upon request please contact us for more information Our Free Sample Report Consists of the following The updated report for 2026 includes an introduction an overview and an indepth industry analysisProvide detailed chapterbychapter guidance on the RequestUpdated Regional Analysis with a Graphical Representation of Size Share and Trends for the Year 2026Includes tables and figures that have been updatedThe most recent version of the report includes the Top Market Players their Business Strategies Sales Volume and Revenue AnalysisCustom Market Insights CMI research methodology Please note that the sample of the Tunable Diode Laser Spectrometers report has been modified to include the COVID19 impact study prior to delivery Request a Customized Copy ofthe Tunable Diode Laser Spectrometers MarketReport httpswwwcustommarketinsightscomreporttunablediodelaserspectrometersmarket Segment Insight By Product Type As of 2025 by products insitu tunable diode laser spectrometers are the largest portion of the tunable diode laser spectrometer market due to the need to offer directinsertion realtime analysis with no sampling lines or conditioning systems and are suitable in harsh process environments of refineries power plants and chemical facilities These systems are necessary in sustained emission monitoring combustion control and safety applications with intensive growth through advancements in sturdy probe designs and multigas functions that foster measurement stability and minimize upkeep generally considered by process engineers to be a decisive factor in achieving regulatory compliance and operational effectiveness with no interruptions By Distribution Channel Direct sales by manufacturers have the greatest market share which is the main form of custom probe setups technical integration services calibration services and regulatory compliance documentation The oil and gas operators power utilities and chemical plants with missioncritical processes of gas analysis are seeking an expert application in engineering onsite commissioning and longterm performance assurance and therefore prefer these channels Request a Customized Copy ofthe Tunable Diode Laser Spectrometers MarketReport httpswwwcustommarketinsightscomreporttunablediodelaserspectrometersmarket Key questions answered in this report What is the size of the Tunable Diode Laser Spectrometers market and what is its expected growth rateWhat are the primary driving factors that push the Tunable Diode Laser Spectrometers market forwardWhat are the Tunable Diode Laser Spectrometers Industrys top companiesWhat are the different categories that the Tunable Diode Laser Spectrometers Market caters toWhat will be the fastestgrowing segment or regionIn the value chain what role do essential players playWhat is the procedure for getting a free copy of the Tunable Diode Laser Spectrometers market sample report and company profiles Key Offerings Market Share Size amp Forecast by Revenue 20262035Market Dynamics Growth Drivers Restraints Investment Opportunities and Leading TrendsMarket Segmentation A detailed analysis by Types of Services by EndUser Services and by regionsCompetitive Landscape Top Key Vendors and Other Prominent Vendors Buy this Premium Tunable Diode Laser Spectrometers Research Report Fast Delivery Available 220 Pages httpswwwcustommarketinsightscomreporttunablediodelaserspectrometersmarket Regional Insights Asia Pacific is at the forefront in manufacturing tunable diode laser spectrometers in the world because of the high rate of industrialization tremendous growth of oil and gas power and petrochemical industries strict regulation of emissions in China and India and heavy investment in infrastructure that creates an evergrowing monitoring requirement The area is enjoying the experience of large manufacturing centers the retrofitting of ultralow coal plants and an increased use of sophisticated insitu process optimization and compliance systems In the meantime the market oftunable diode laser spectrometersis growing at high rates in North America due to the strict EPA and environmental regulations the modernization of the outdated industrial complexes the emphasis on the safety and hydrogen infrastructure at the workplace and largescale investments in digital process regulation Such countries as the United States enjoy the highquality technology adoption sour gas monitoring software and early adoption of AIenhanced analyzers within the framework of regulatory legislation and safety measures in the industry Request a Customized Copy ofthe Tunable Diode Laser Spectrometers MarketReport httpswwwcustommarketinsightscomreporttunablediodelaserspectrometersmarket We customize your report to align with your specific research requirements Inquire with our sales team about customizing your report Still Looking for More Information Do you want data for inclusion in magazines case studies research papers or media Email Directly Here with Detailed Information supportcustommarketinsightscom Browse the fullTunable Diode Laser Spectrometers Market Size Trends and Insights By Product Type Tunable Diode Laser Absorption Spectroscopy TDLAS Analyzers SinglePass MultiPass CavityEnhanced TDLAS CRDS OAICOS CEAS Wavelength Modulation Spectroscopy WMS Systems Frequency Modulation Spectroscopy FMS Systems Other Product Types Photoacoustic Laser Spectroscopy DualComb Spectroscopy By Technology NearInfrared NIR TDLAS 780 nm2500 nm TelecomGrade DFB Lasers MidInfrared MIR TDLAS 25 m20 m QCL ICL Other Technologies FarInfrared Terahertz Laser Spectroscopy By Application Gas Concentration Measurement O CO CO CH HO NH HCl HF HS Isotope Ratio Analysis C D O CC Process Gas Analysis Reaction Monitoring Feed Gas Purity Product Gas Quality Combustion Monitoring Oxygen Trim Excess Air Control Flue Gas Analysis Environmental amp Atmospheric Monitoring Trace Gas Greenhouse Gas Air Quality Other Applications Breath Analysis Leak Detection Food Quality By EndUse Industry Oil amp Gas Upstream Midstream Downstream LNG Chemical amp Petrochemical Power Generation Coal Gas Nuclear Biomass Environmental Monitoring Regulatory Research Urban Air Quality Pharmaceutical amp Life Sciences Semiconductor Manufacturing Food amp Beverage Headspace Analysis Modified Atmosphere Packaging Other Industries Metals amp Mining Cement Glass Pulp amp Paper and By Region Global Industry Overview Statistical Data Competitive Analysis Share Outlook and Forecast 2026 2035Report athttpswwwcustommarketinsightscomreporttunablediodelaserspectrometersmarket Report Scope Feature of the ReportDetailsMarket Size in 2026USD 092 billionProjected Market Size in 2035USD 214 billionMarket Size in 2025USD 084 billionCAGR Growth Rate88 CAGRBase Year2025Forecast Period20262035Key SegmentBy Product Type Technology Application EndUse Industry and RegionReport CoverageRevenue Estimation and Forecast Company Profile Competitive Landscape Growth Factors and Recent TrendsRegional ScopeNorth America Europe Asia Pacific Middle East amp Africa and South amp Central AmericaBuying OptionsRequest tailored purchasing options to fulfil your requirements for research Recent Developments In April 2025MettlerToledoextended its line of GPro 500 tunable diode laser spectrometers to include a new type of foldedpath probe design which allows a period of up to one year without alignment checks greatly improving reliability and minimizing maintenance in harsh process environments Click Here to Access a Free Sample Report of the Global Tunable Diode Laser Spectrometers Market httpswwwcustommarketinsightscomreporttunablediodelaserspectrometersmarket Spectacular Deals Comprehensive coverageMaximum number of market tables and figuresThe subscriptionbased option is offeredBest price guaranteeFree 35 or 60 hours of customizationFree postsale service assistance25 discount on your next purchaseService guarantees are availableA personalized market brief by the author Browse More Related Reports High Definition Oscilloscopes Market High Definition Oscilloscopes Market Size Trends and Insights By Component Hardware Software Services By Type Digital Storage Oscilloscopes Mixed Signal Oscilloscopes RealTime Oscilloscopes By Bandwidth Below 500 MHz 500 MHz 1 GHz Above 1 GHz By Channel Type 2Channel Oscilloscopes 4Channel Oscilloscopes MultiChannel Oscilloscopes By Application Automotive Electronics Testing Consumer Electronics Design Telecommunications Aerospace amp Defense Research amp Education By End User Electronics Manufacturers Automotive Companies Telecommunications Providers Research Laboratories Academic Institutions and By Region Global Industry Overview Statistical Data Competitive Analysis Share Outlook and Forecast 2026 2035 Core Current Sensor Market Core Current Sensor Market Size Trends and Insights By Type ClosedLoop Core Current Sensors OpenLoop Core Current Sensors By Technology HallEffect Sensors Fluxgate Sensors Magnetoresistive Sensors By Output Type Analog Digital By Application Motor Control Battery Management Systems Power Supply Monitoring Renewable Energy Systems Electric Vehicles By EndUse Industry Automotive Industrial Automation Energy amp Power Consumer Electronics Telecommunications and By Region Global Industry Overview Statistical Data Competitive Analysis Share Outlook and Forecast 2026 2035 Power Schottky Diode Market Power Schottky Diode Market Size Trends and Insights By Material Type Silicon Si Silicon Carbide SiC Gallium Nitride GaN Other Material Types Germanium Gallium Arsenide By Package Type Surface Mount SOD SMA SMB SMC PowerDI DPAK D2PAK ThroughHole DO41 DO15 DO201 Axial Lead Chip Scale Package WLCSP FlipChip Other Package Types PressFit Power Module Integrated By Application Power Supplies amp Converters SMPS Server PSU Adapters Motor Drives amp Inverters Solar amp Renewable Energy Bypass Diodes String Inverters Microinverters Electric Vehicles amp Charging Infrastructure Consumer Electronics Smartphones Laptops Wearables Telecommunications amp Data Centers Other Applications Railways Medical Equipment By EndUse Industry Automotive Industrial Consumer Electronics Telecommunications amp Data Centers Energy amp Power Other Industries Medical Defense Aerospace and By Region Global Industry Overview Statistical Data Competitive Analysis Share Outlook and Forecast 2026 2035 Low Voltage DC Circuit Breaker Market Low Voltage DC Circuit Breaker Market Size Trends and Insights By Type Molded Case Circuit Breakers MCCB Miniature Circuit Breakers MCB Air Circuit Breakers ACB Insulated Case Circuit Breakers ICCB Other Types SolidState Circuit Breakers Hybrid By Voltage Rating Up to 250V 251V500V 501V750V Above 750V up to 1500V By Application Solar PV Systems Battery Energy Storage Systems BESS Electric Vehicles amp Charging Infrastructure Data Centers amp Telecom Industrial Automation amp Machinery Marine amp Shipboard Power Other Applications Railways Microgrids By EndUse Residential Commercial Industrial Utility and By Region Global Industry Overview Statistical Data Competitive Analysis Share Outlook and Forecast 2026 2035 Digital Twin in Marine Market Digital Twin in Marine Market Size Trends and Insights By Component Software Digital Twin Platforms Simulation Software Analytics Hardware IoT Sensors Edge Computing Devices Connectivity Equipment Services Consulting Integration Managed Services Training By Application Fleet Management amp Operations Predictive Maintenance Ship Design amp Engineering Port amp Harbor Management Cargo amp Logistics Optimization Training amp Simulation Other Applications Environmental Compliance Safety Management By Deployment Mode CloudBased OnPremise Hybrid By EndUser Commercial Shipping Container Tanker Bulk Carrier Cruise Naval amp Defense Offshore Oil amp Gas Port Authorities amp Terminal Operators Shipbuilders amp Yards Other EndUsers and By Region Global Industry Overview Statistical Data Competitive Analysis Share Outlook and Forecast 2026 2035 Electronic Skin Patch Market Electronic Skin Patch Market Size Trends and Insights By Application Health Monitoring Drug Delivery Wound Care Others By Component Sensors Actuators Electronics Others By EndUser Hospitals Home Care Clinics Others and By Region Global Industry Overview Statistical Data Competitive Analysis Share Outlook and Forecast 2025 2034 Air Fryer Market Air Fryer Market Size Trends and Insights By Device Manual Automatic By Capacity Up to 4 Liters 4 Liters to 6 Liters 6 Liters to 8 Liters Above 8 Liters By Application Residential Commercial By Distribution Channel Online Offline and By Region Global Industry Overview Statistical Data Competitive Analysis Share Outlook and Forecast 2025 2034 Floor POP Display Market Floor POP Display Market Size Trends and Insights By Material Type Corrugated Cardboard Foam Board Metal Acrylic Wood Others By Display Type Standees Dump Bins Shelf Talkers Sidekicks Display Racks Others By EndUse Industry Retail Food amp Beverage Cosmetics amp Personal Care Electronics Pharmaceuticals Others and By Region Global Industry Overview Statistical Data Competitive Analysis Share Outlook and Forecast 2025 2034 List of the prominent players in the Tunable Diode Laser Spectrometers Market ABB Ltd Analytical Instruments DivisionSiemens AG Process AnalyticsEndressHauser GroupYokogawa Electric CorporationEmerson Electric Co Rosemount AnalyticalPicarro IncLos Gatos Research PolyScienceNEO Monitors ASAxetris AGCascade Technologies Ltd EmersonMettlerToledo International IncOthers TheTunable Diode Laser Spectrometers Marketis segmented as follows By Product Type Tunable Diode Laser Absorption Spectroscopy TDLAS Analyzers SinglePass MultiPassCavityEnhanced TDLAS CRDS OAICOS CEASWavelength Modulation Spectroscopy WMS SystemsFrequency Modulation Spectroscopy FMS SystemsOther Product Types Photoacoustic Laser Spectroscopy DualComb Spectroscopy By Technology NearInfrared NIR TDLAS 780 nm2500 nm TelecomGrade DFB LasersMidInfrared MIR TDLAS 25 m20 m QCL ICLOther Technologies FarInfrared Terahertz Laser Spectroscopy By Application Gas Concentration Measurement O CO CO CH HO NH HCl HF HSIsotope Ratio Analysis C D O CCProcess Gas Analysis Reaction Monitoring Feed Gas Purity Product Gas QualityCombustion Monitoring Oxygen Trim Excess Air Control Flue Gas AnalysisEnvironmental amp Atmospheric Monitoring Trace Gas Greenhouse Gas Air QualityOther Applications Breath Analysis Leak Detection Food Quality By EndUse Industry Oil amp Gas Upstream Midstream Downstream LNGChemical amp PetrochemicalPower Generation Coal Gas Nuclear BiomassEnvironmental Monitoring Regulatory Research Urban Air QualityPharmaceutical amp Life SciencesSemiconductor ManufacturingFood amp Beverage Headspace Analysis Modified Atmosphere PackagingOther Industries Metals amp Mining Cement Glass Pulp amp Paper Click Here to Get a Free Sample Report of the Global Tunable Diode Laser Spectrometers Market httpswwwcustommarketinsightscomreporttunablediodelaserspectrometersmarket Regional Coverage North America USCanadaMexicoRest of North America Europe GermanyFranceUKRussiaItalySpainNetherlandsRest of Europe Asia Pacific ChinaJapanIndiaNew ZealandAustraliaSouth KoreaTaiwanRest of Asia Pacific The Middle East amp Africa Saudi ArabiaUAEEgyptKuwaitSouth AfricaRest of the Middle East amp Africa Latin America BrazilArgentinaRest of Latin America This Tunable Diode Laser Spectrometers Market ResearchAnalysis Report Contains Answers to the following Questions Which Trends Are Causing These DevelopmentsWho Are the Global Key Players in This Tunable Diode Laser Spectrometers Market What are the company profiles product information and contact details for these key playersWhat Was the Global Market Status of the Tunable Diode Laser Spectrometers Market What Was the Capacity Production Value Cost and PROFIT of the Tunable Diode Laser Spectrometers MarketWhat Is the Current Market Status of the Tunable Diode Laser Spectrometers Industry Whats the markets competition in this industry both companywise and countrywise Whats Market Analysis of Tunable Diode Laser Spectrometers Market by Considering Applications and TypesWhat Are Projections of the Global Tunable Diode Laser Spectrometers Industry Considering Capacity Production and Production Value What Will Be the Estimation of Cost and Profit What Will Be Market Share Supply and Consumption What about imports and exportsWhat is a Tunable Diode Laser Spectrometers market chain analysis of upstream raw materials and downstream industriesWhat is the economic impact on the Tunable Diode Laser Spectrometers industry What are Global Macroeconomic Environment Analysis Results What Are Global Macroeconomic Environment Development TrendsWhat Are the Market Dynamics of the Tunable Diode Laser Spectrometers Market What Are Challenges and OpportunitiesWhat Should Be Entry Strategies Countermeasures to Economic Impact and Marketing Channels for Tunable Diode Laser Spectrometers Industry Click Here to Access a Free Sample Report of the Global Tunable Diode Laser Spectrometers Market httpswwwcustommarketinsightscomreporttunablediodelaserspectrometersmarket Reasons to Purchase Tunable Diode Laser Spectrometers Market Report The Tunable Diode Laser Spectrometers Market Report provides qualitative and quantitative analysis of the market based on segmentation involving economic and noneconomic factorsTunable Diode Laser Spectrometers The Market report outlines market value USD data for each segment and subsegmentThis report indicates the region and segment expected to witness the fastest growth and dominate the marketTunable Diode Laser Spectrometers Market Analysis by geography highlights the consumption of the productservice in the region and indicates the factors affecting the market within each regionThe competitive landscape incorporates the market ranking of the major players along with new serviceproduct launches partnerships business expansions and acquisitions in the past five years of companies profiledExtensive company profiles comprise a company overview company insights product benchmarking and SWOT analysis for the major market playersRecent developments including growth opportunities and drivers as well as challenges and restraints in both emerging and developed regions shape the industrys current and future market outlookTunable Diode Laser Spectrometers Market Includes indepth market analysis from various perspectives through Porters five forces analysis and offers an overview of the market through the value chain Reasons for the Research Report The study provides a thorough overview of the global Tunable Diode Laser Spectrometers market Compare your performance to that of the market as a whole Aim to maintain competitiveness while innovations from established leaders drive market growth Buy this Premium Tunable Diode Laser Spectrometers Research Report Fast Delivery Available 220 Pages httpswwwcustommarketinsightscomreporttunablediodelaserspectrometersmarket What does the report include Drivers restrictions and opportunities are among the qualitative elements covered in the worldwide Tunable Diode Laser Spectrometers market analysis The report covers the competitive environment of current and potential participants in the Tunable Diode Laser Spectrometers market along with their strategic product development ambitions This study conducts a qualitative and quantitative analysis of the Tunable Diode Laser Spectrometers market based on the component application and industry vertical Additionally the report provides comparable data for the key regions The report provides actual market sizes and forecasts for each segment mentioned above Who should buy this report Participants and stakeholders worldwide Tunable Diode Laser Spectrometers market should find this report useful The research will be useful to all market participants in the Tunable Diode Laser Spectrometers industry Managers in the Tunable Diode Laser Spectrometers sector are interested in publishing uptodate and projected data about the worldwide Tunable Diode Laser Spectrometers market Governmental agencies regulatory bodies decisionmakers and organizations want to invest in Tunable Diode Laser Spectrometers products market trends Analysts researchers educators strategy managers and government organizations seek market insights to develop plans Request a Customized Copy of the Tunable Diode Laser Spectrometers Market Report httpswwwcustommarketinsightscomreporttunablediodelaserspectrometersmarket About Custom Market Insights Custom Market Insightsis a market research and advisory company delivering business insights and market research reports to large small and mediumscale enterprises We assist clients with strategies and business policies and regularly work towards achieving sustainable growth in their respective domains CMI is a onestop solution for data collection and investment advice Our companys expert analysis digs out essential factors that help us understand the significance and impact of market dynamics The professional experts advise clients on aspects such as strategies for future estimation forecasting opportunities to grow and consumer surveys Follow UsLinkedIn Twitter Facebook YouTube Contact Us Frank Gittens CMI Consulting LLC 701 Tillery Street Unit 121333 Austin Texas 78702 United States USA 1 7377342707 APAC 91 20 46022736 WhatsApp No 1 801 639 9061 Emailsupportcustommarketinsightscom Webhttpswwwcustommarketinsightscom Bloghttpswwwbriinsightscom Blog httpscmimarketresearchcom Buy this Premium Tunable Diode Laser Spectrometers Research Report Fast Delivery Available 220 Pages httpswwwcustommarketinsightscomreporttunablediodelaserspectrometersmarket

Vicor Corporation Reports Results for the First Quarter Ended March 31, 2026
ANDOVER Mass April 21 2026 GLOBE NEWSWIRE Vicor Corporation NASDAQ VICR today reported financial results for the first quarter ended March 31 2026 These results will be discussed at 800 am Eastern Time during managements quarterly investor conference call The details for the call are below Product and royalty revenues for the first quarter ended March 31 2026 totaled 1130 million a 202 increase from 940 million for the corresponding period a year ago and a 53 sequential increase from 1073 million in the fourth quarter of 2025 Gross margin increased to 624 million for the first quarter of 2026 compared to 444 million for the corresponding period a year ago and increased sequentially from 594 million for the fourth quarter of 2025 Gross margin as a percentage of revenue increased to 552 for the first quarter of 2026 compared to 472 for the corresponding period a year ago and decreased from 554 for the fourth quarter of 2025 Operating expenses increased to 455 million for the first quarter of 2026 compared to 445 million for the corresponding period a year ago and increased sequentially from 437 million for the fourth quarter of 2025 Net income for the first quarter was 207 million or 044 per diluted share compared to net income of 25 million or 006 per diluted share for the corresponding period a year ago and net income of 465 million or 101 per diluted share for the fourth quarter of 2025 Net income in the fourth quarter included 273 million of tax benefit due to the partial recognition of certain deferred tax assets in the period Cash flow used for operations totaled 39 million for the first quarter net of a 286 million payment of an award for past litigation compared to cash flow from operations of 201 million for the corresponding period a year ago and cash flow from operations of 157 million in the fourth quarter of 2025 Capital expenditures for the first quarter totaled 124 million compared to 46 million for the corresponding period a year ago and 55 million for the fourth quarter of 2025 Cash and cash equivalents as of March 31 2026 increased 04 sequentially to approximately 4042 million compared to approximately 4028 million as of December 31 2025 Backlog for the first quarter ended March 31 2026 totaled 301 million a 75 increase from 172 million for the corresponding period a year ago and a 70 sequential increase from 177 million at the end of the fourth quarter of 2025 Commenting on first quarter performance Chief Executive Officer Dr Patrizio Vinciarelli stated Rising demand across highperformance compute automatic test equipment and industrial aerospace and defense applications is reflected in a 70 sequential increase in backlog setting the stage for revenue growth We are expanding capacity with additional equipment in our first CHiP fab while planning a second fab Expanding total capacity with a second fab and an alternate source of high current density 2nd Gen VPD modules will give OEMs and Hyperscalers redundant access to enabling VPD power system technology Precluding unlawful importation of computing systems infringing Vicor IP is having an effect The industry is learning to pay attention to the multiplicity of innovations pioneered by Vicor and the need for a license to avoid disruption of supply from copycat power system manufacturers For more information on Vicor and its products please visit the Companys website at wwwvicorpowercom Earnings Conference Call Vicor will be holding its investor conference call today Tuesday April 21 2026 at 800 am Eastern Time Vicor encourages investors and analysts who intend to ask questions via the conference call to register with Notified the service provider hosting the conference call Those registering on Notifieds website will receive dialin info and a unique PIN to join the call as well as an email confirmation with the details Registration may be completed at any time prior to 800 am on April 21 2026 For those parties interested in listenonly mode the conference call will be webcast via a link that will be posted on the Investor Relations page of Vicors website prior to the conference call Please access the website at least 15 minutes prior to the conference call to register and if necessary download and install any required software For those who cannot participate in the live conference call a webcast replay of the conference call will also be available on the Investor Relations page of Vicors website This press release contains certain forwardlooking statements within the meaning of Section 27A of the Securities Act of 1933 as amended and Section 21E of the Securities Exchange Act of 1934 as amended Any statement in this press release that is not a statement of historical fact is a forwardlooking statement and the words believes expects anticipates intends estimates plans assumes may will would should continue prospective project and other similar expressions identify forwardlooking statements Forwardlooking statements also include statements regarding bookings shipments revenue profitability targeted markets increase in manufacturing capacity and utilization thereof future products and capital resources These statements are based upon managements current expectations and estimates as to the prospective events and circumstances that may or may not be within the companys control and as to which there can be no assurance Actual results could differ materially from those projected in the forwardlooking statements as a result of various factors including those economic business operational and financial considerations set forth in Vicors Annual Report on Form 10K for the year ended December 31 2025 under Part I Item I Business under Part I Item 1A Risk Factors under PartI Item3 Legal Proceedings and under PartII Item7 Managements Discussion and Analysis of Financial Condition and Results of Operations The risk factors set forth in the Annual Report on Form 10K may not be exhaustive Therefore the information contained in the Annual Report on Form 10K should be read together with other reports and documents filed with the Securities and Exchange Commission from time to time including Forms 10Q 8K and 10K which may supplement modify supersede or update those risk factors Vicor does not undertake any obligation to update any forwardlooking statements as a result of future events or developments Vicor Corporation designs develops manufactures and markets modular power components and complete power systems based upon a portfolio of patented technologies Headquartered in Andover Massachusetts Vicor sells its products to the power systems market including enterprise and high performance computing industrial equipment and automation telecommunications and network infrastructure vehicles and transportation and aerospace and defense electronics For further information contactJames F Schmidt Chief Financial OfficerOffice 978 4702900Email invrelvicorpowercom VICOR CORPORATIONCONDENSED CONSOLIDATED STATEMENT OF OPERATIONSThousands except for per share amountsQUARTER ENDEDUnauditedMAR 31MAR 3120262025Product revenue9800483206Royalty revenue1496510762Net revenues11296993968Cost of product revenues5060349603Gross margin6236644365Operating expensesSelling general and administrative2319225137Research and development2229019377Total operating expenses4548244514Income loss from operations16884149Other income expense net35193134Income before income taxes204032985Less Benefit provision for income taxes273424Consolidated net income206762561Less Net income attributable to noncontrolling interest1222Net income attributable to Vicor Corporation206642539Net income per share attributable to Vicor CorporationBasic045006Diluted044006Shares outstandingBasic4547045217Diluted4725445495 VICOR CORPORATIONCONDENSED CONSOLIDATED BALANCE SHEETThousandsMAR 31DEC 3120262025UnauditedUnauditedAssetsCurrent assetsCash and cash equivalents404245402805Accounts receivable net6740260716Inventories9483091340Other current assets3299232502Total current assets599469587363Longterm deferred tax assets2779827463Longterm investment net25082462Property plant and equipment net154637147690Other assets2046920853Total assets804881785831Liabilities and EquityCurrent liabilitiesAccounts payable1673312290Accrued compensation and benefits1345612031Accrued expenses44253691Accrued litigation28275Sales allowances36613136Shortterm lease liabilities14331568Income taxes payable71904Shortterm deferred revenue and customer prepayments21553426Total current liabilities4193465321Longterm income taxes payable31093086Longterm lease liabilities57135608Total liabilities5075674015EquityVicor Corporation stockholders equityCapital stock468216462805Retained earnings442023421359Accumulated other comprehensive loss16971672Treasury stock154682170935Total Vicor Corporation stockholders equity753860711557Noncontrolling interest265259Total equity754125711816Total liabilities and equity804881785831
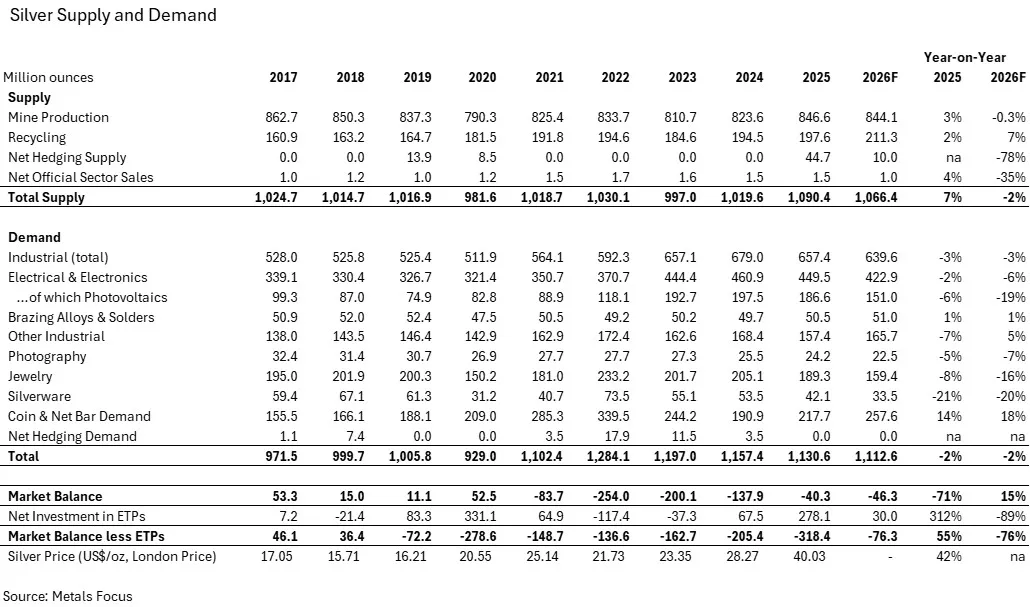
Elevated Lease Rates, Regional Liquidity Tightness, and Robust Investor Interest Resulted in Record Silver Prices in 2025
Silver Market in a Deficit for Fifth Straight Year 2026 Silver Supply and Demand Chart World Silver Survey 2026 Supply and Demand Chart NEW YORK April 15 2026 GLOBE NEWSWIRE Falling inventories a dramatic shift of metal into CME vaults rising exchangetraded product holdings and a surge in bar and coin demand created an unprecedented liquidity squeeze in October 2025 This led to explosive conditions for lease rates and prices Against this backdrop silver prices delivered a remarkable performance last year breaking a series of alltime highs before rallying further in early 2026 Additionally global silver demand exceeded supply for the fifth consecutive year While this narrowed compared to 2024 it continued to place additional pressure on global aboveground silver stocks These and other key aspects of the 2025 silver market are examined inthe World Silver Survey2026 released today by the Silver Institute The88page Surveyalso provides an outlook for the silver market in 2026 The report was researched and produced for the Silver Institute by Metals Focus the Londonbased independent precious metals consultancy Key findings include Silver Demand Total silver demand fell by 2 percent last year to 113 billion ounces Boz as a 14 percent jump in coin and bar demand almost offset losses across other key segments After four years of strong growth silver industrial demand declined by 3 percent to 6574 Moz in 2025 Within the key industrial segments electrical and electronics demand fell by 2 percent As in previous years demand continued to benefit from structural growth in artificial intelligence AI infrastructure strong automotive enduse and healthy power grid investment However these gains were offset by weakness in photovoltaic PV demand as intense competition and rising silver raw material costs prompted PV manufacturers to accelerate thrifting and substitution Demand for brazing alloys rose modestly by 1 percent supported by continued strength in the automotive and aerospace sectors In contrast other industrial demand fell by 7 percent largely due to a slowdown in the ethylene oxide EO market On a regional basis East Asia and South Asia accounted for the majority of losses in 2025 while demand in Europe and North America remained broadly stable Global silver jewelry fabrication fell by 8 percent last year India recorded the steepest decline at 20 percent as recordhigh rupee prices and heightened volatility undermined affordability European demand fell by 10 percent led by Italy amid tariffdriven export declines and weaker endmarket sales while North America dropped by 7 percent By contrast East Asia proved more resilient with China recording a 5 percent gain benefiting from gold substitution and product innovation while Thailand surged by 24 percent on strong exports to India Silverware demand fell by 21 percent to a fouryear low As with jewelry the losses were concentrated in India where far higher prices weighed on discretionary spending After two consecutive years of decline coin and net bar demand rose by 14 percent in 2025 Strong gains were recorded across most regions except in the US India led with a 33 percent increase while Europe posted its first rise in three years The Middle East and China recorded multifold gains driven by rising investor interest amid higher prices and a low base in prior years By contrast the US posted a third consecutive year of losses as President Trumps election dampened safehaven buying Profittaking during the price rally particularly in the first nine months of the year also weighed on US demand Silver Supply Global silvermine productionrose by 3percentto 8466 Moz in 2025 driven by higher byproduct output from copper operations in Peru and the rampup of Polymetal JSCs Prognoz mine in Russia Additionally smaller gains were recorded in China and Morocco although these were partly offset by lower output from key operations in Mexico and a decline in Indonesia From a regional standpoint output from North America fell by 3 percent to its lowest level in 10 years However supply from Central amp South America rose by 5 while that from Asia fell by 1 percent Lead and zinc mines remained the largest source of silver but their share of globalsupply edged lower yy In contrast output from gold and copper operations increased by 5 percent and 6 percent respectively Recycling rose by 2 percent in 2025 to a 12year high of 1976 Moz Jewelry and silverware were the key segments that saw significant selling although refinery bottlenecks capped volumes In terms of industrial recycling scrap from ethylene oxide rose while escrap volumes fell Outlook for Silver in 2026 Total demand this year is forecast to fall modestly by 2 percent to 111 Boz Doubledigit losses are expected in jewelry and silverware as the impact of higher prices continues Industrial demand is projected to decline by 3 percent chiefly due to a further and marked slowdown in PV offtake Some of these losses will be mitigated by firmer coin and net bar demand which is expected to jump by 18 percent Global silver mine production is expected to remain flat in 2026 Broader graderelated and operational pressures across key producing regions should offset modest growth at a limited number of assets With mine production stable this year we expect the structural market deficit to widen to 463 Moz As outlined in World Silver Survey 2026 while the Iran war has undoubtedly complicated the shortterm outlook the broader macroeconomic and geopolitical backdrop remains supportive for silver prices This assumes that the situation will be relatively contained and that the recent pressure on precious metals prices from rising US rate expectations will prove temporary Further elevated policy uncertainty sovereign debt risks and concerns over the future role of the US dollar remain relevant Silver Price Following a 42 rise in the annual average price in 2025 early 2026 saw the rally accelerate accompanied by heightened volatility Prices surged to an alltime high above 121 on January 29 before falling back sharply with the metal trading in the mid70s in early April About theWorld Silver Surveyand Ordering Information The Silver Institute has published this annual report on the global silver market since 1990 to bring reliable supply and demand statistics to market participants and the public Metals Focus independently researched and produced the 36th edition of the World Silver Survey The report was sponsored by 22 companies from North and South America Asia and Europe A complimentary PDF version ofWorld Silver Survey 2026can be downloaded from the Institutes website atwwwsilverinstituteorgIn North America hard copies may be purchased from the Institutes website for copies outside North America please contact Metals Focus atwwwmetalsfocuscom In addition members of the media and government officials can request complimentary hard copies of the Survey directly from the Silver Institute Contacts Michael DiRienzoSilver Institute12024954030mdirienzosilverinstituteorgPhilip NewmanMetals Focus442033016510philipnewmanmetalsfocuscom A photo accompanying this announcement is available athttpswwwglobenewswirecomNewsRoomAttachmentNg83338590aebf4735a4dc160262297c2c

Firefly Aerospace Successfully Launches Alpha Flight 7
Stairway to Seven mission tested and validated key Alpha Block II upgrades ahead of Flight 8 LOMPOC Calif March 11 2026 GLOBE NEWSWIRE Firefly Aerospace Nasdaq FLY a market leading space and defense technology company today announced the successful launch of its Alpha Flight 7 Stairway to Seven mission Alpha lifted off from Fireflys Space Launch Complex 2 at the Vandenberg Space Force Base at 550 pm PDT on March 11 before completing an orbital insertion and delivering a demonstrator payload for Lockheed Martin Fireflys Alpha rocket also performed a stage two engine relight and validated key Alpha Block II upgrades including a new inhouse avionics suite and enhanced thermal protection system ahead of the full Block II configuration upgrade planned for Flight 8 Alpha Flight 7 was flawlessly executed with all mission requirements completed further proving the resiliency innovation and passion of the Firefly team said Jason Kim CEO of Firefly Aerospace Over the last several months we took a hard look at our processes across engineering production test integration and operations and invested the time required to make a series of improvements to ensure a higher level of quality and reliability in every Alpha we deliver and launch as we move to our Block II upgrade The Firefly team is now working to complete the final milestones for Alpha Flight 8 that is set to launch the full Block II configuration upgrade designed to enhance reliability and manufacturability across the vehicle The upgrades include a 7foot increase to Alphas length consolidated batteries and avionics built in house improved thermal protection system and stronger carbon composite structures built with automated machinery Flight 7 served as a critical opportunity to validate Alphas performance ahead of our Block II upgrade and this team knocked it out of the park said Adam Oakes Vice President of Launch at Firefly Aerospace Im incredibly proud of the Firefly team for continuing to define perseverance We have full confidence in our Alpha rocket and were committed to continuous improvement as we roll out Block II We want to thank Space Launch Delta 30 and our customers for their ongoing collaboration and support About Firefly Aerospace Firefly Aerospace is a space and defense technology company that enables government and commercial customers to launch land and operate in space anywhere anytime As the partner of choice for responsive space missions Firefly is the only commercial company to launch a satellite to orbit with approximately 24hour notice Firefly is also the only company to achieve a fully successful landing on the Moon Established in 2017 Fireflys engineering manufacturing and test facilities are colocated in central Texas to enable rapid innovation The companys small to mediumlift launch vehicles lunar landers and orbital vehicles are built with common flightproven technologies to enable speed reliability and cost efficiencies for each mission from low Earth orbit to the Moon and beyond For more information visitwwwfireflyspacecom ForwardLooking StatementThis press release containsforwardlooking statements including but not limited to statements regarding theexpectationsregarding Alpha Flight 8 thebenefitsand expectationsof the Alpha Block II upgrade and other statements regarding Fireflys future expectations beliefs plans objectives financial conditions assumptions future events or performance that are not historical facts In some cases you can identify forwardlooking statements because they contain words such asset preparemay will expects plans anticipates could would intendsandbelieves Theremay also be negative words or other similar terms or expressions that concern our expectations strategy plans or intentions Not all forwardlooking statements contain such identifying words The inclusion of forwardlooking statements should not be regarded as a representation that such plans estimates or expectations will be achieved Readers are cautioned not to place undue reliance on the forwardlooking statements contained herein which speak only as of the date hereof These statements are based on managements current expectations assumptions and beliefs concerning future developments which are inherently subject to uncertainties risks and changes in circumstances that are difficult to predict We cannot assure you that the events reflected in the forwardlooking statements will occur actual events could differ materially from those described in the forwardlooking statements In addition to the risks and uncertainties of our ordinary business operations and conditions in the general economy and markets in which we compete the forwardlooking statements in this press release are subject to the risks uncertainties and other factors disclosed in our filings with the US Securities and ExchangeCommission including our Form 10Q for the quarterly period ended September 30 2025 which risks uncertainties and other factors could cause actual events to differ materially from those described in the forwardlooking statements Anyforwardlooking statement speaks only as of the date as of which such statement is made and except as required by law we undertake no obligation to update or revise publicly any forwardlooking statements whether because of new information future events etc Media Contactpressfireflyspacecom VideoImage GalleryFlickr Alpha Flight 7 Stairway to Seven A photo accompanying this announcement is available at httpswwwglobenewswirecomNewsRoomAttachmentNg601974580a6b41758d7916628937a633
PyroGenesis Announces Oversubscription of Non-Brokered Private Placement
Company will not accept any further requests for participationMONTREAL March 11 2026 GLOBE NEWSWIRE PyroGenesis Inc PyroGenesis or the Company TSX PYR OTCQX PYRGF FRA 8PY1 a leader in ultrahigh temperature processes and engineering innovation and a plasmabased technology provider to heavy industry amp defense announces today that further to its recently announced press release dated March 9 2026 the nonbrokered private placement the Private Placement is oversubscribed and the Company will not accept any further requests for participation The Company expects to close the Private Placement within ten days subject to regulatory approval The Private Placement was originally structured to raise up to approximately 1000000 through the issuance and sale of up to 1851852 units of the Company the Units The Company is in the process of collecting supporting documentation and finalizing subscription agreements The Company estimates the final subscription amounts to be between 1700000 and 1900000 for between 3148148 and 3518518 Units The offering for the Private Placement consists of an issuance of Units of the Company at a price of 054 per Unit Each Unit consists of one common share of PyroGenesis a Common Share and onehalf of a Common Share purchase warrant each whole such common share purchase warrant a Warrant of the Company Each Warrant entitles the holder thereof to purchase one Common Share at a price of 070 for a period of 36 months following the closing date of the Private Placement The Common Shares and Warrants issued in connection with the Private Placement and the Common Shares underlying the Warrants will be subject to a statutory hold period of four months and one day from the date of closing in accordance with applicable securities legislation Under the terms of the Common Share Purchase Warrant Indenture the Company will have the right to accelerate the expiry date of the Warrants provided that if at any time before their expiry date the closing price of the Common Shares on the TSX is greater than 090 in 2 of any 5 consecutive trading days the Company will be entitled within 15 days of the occurrence of such event to accelerate the expiry date of the Warrants to the date that is 30 days following the date that notice of such acceleration the Acceleration Notice is provided Such notice shall be deemed to have been provided upon either the email notification of the holders of such Warrants or the issuance of a press release by the Company announcing the achievement of the acceleration event Among the interested participants P Peter Pascali the President and CEO of PyroGenesis will directly subscribe for up to approximately 400000 which represents the maximum dollar amount that insiders as a group are allowed to participate in by the regulators at this time The regulations limit the amount of participation by insiders to a certain percentage of total shares outstanding net the amount that insiders have participated in over the past several months The Company intends to use the net proceeds from the Private Placement for working capital and general corporate purposes This news release does not constitute an offer to sell or a solicitation of an offer to buy any of the securities in the United States The securities have not been and will not be registered under the United States Securities of 1933 as amended or any state securities laws and may not be offered or sold within the United States unless an exemption from such registration is available The Private Placement remains subject to the TSXs final approval as well as other customary closing conditions About PyroGenesis Inc PyroGenesis leverages 35 years of plasma technology leadership to deliver advanced engineering solutions to energy propulsion destruction process heating emissions and materials development challenges across heavy industry and defense Its customers include global leaders in aluminum aerospace steel iron ore utilities environmental services military and government From its Montreal headquarters and local manufacturing facilities PyroGenesis engineers scientists and technicians drive innovation and commercialization of energy transition and ultrahigh temperature technology PyroGenesis operations are ISO 90012015 and AS9100D certified with ISO certification maintained since 1997 PyroGenesis shares trade on the TSX PYR OTCQX PYRGF and Frankfurt 8PY1 stock exchanges Cautionary and ForwardLooking Statements This press release contains forwardlooking information and forwardlooking statements collectively forwardlooking statements within the meaning of applicable securities laws In some cases but not necessarily in all cases forwardlooking statements can be identified by the use of forwardlooking terminology such as plans targets expects or does not expect is expected an opportunity exists is positioned estimates intends assumes anticipates or does not anticipate or believes or variations of such words and phrases or state that certain actions events or results may could would might will or will be taken occur or be achieved In addition any statements that refer to expectations projections or other characterizations of future events or circumstances contain forwardlooking statements Forwardlooking statements are not historical facts nor guarantees or assurances of future performance but instead represent managements current beliefs expectations estimates and projections regarding future events and operating performance Forwardlooking statements are necessarily based on a number of opinions assumptions and estimates that while considered reasonable by PyroGenesis as of the date of this release are subject to inherent uncertainties risks and changes in circumstances that may differ materially from those contemplated by the forwardlooking statements Important factors that could cause actual results to differ possibly materially from those indicated by the forwardlooking statements include but are not limited to the risk factors identified under Risk Factors in PyroGenesis latest annual information form and in other periodic filings that it has made and may make in the future with the securities commissions or similar regulatory authorities all of which are available under PyroGenesis profile on SEDAR at wwwsedarplusca These factors are not intended to represent a complete list of the factors that could affect PyroGenesis However such risk factors should be considered carefully There can be no assurance that such estimates and assumptions will prove to be correct You should not place undue reliance on forwardlooking statements which speak only as of the date of this release PyroGenesis undertakes no obligation to publicly update or revise any forwardlooking statement except as required by applicable securities laws Neither the Toronto Stock Exchange its Regulation Services Provider as that term is defined in the policies of the Toronto Stock Exchange nor the OTCQX Best Market accepts responsibility for the adequacy or accuracy of this press release For further information contact irpyrogenesiscom or visit httpwwwpyrogenesiscom
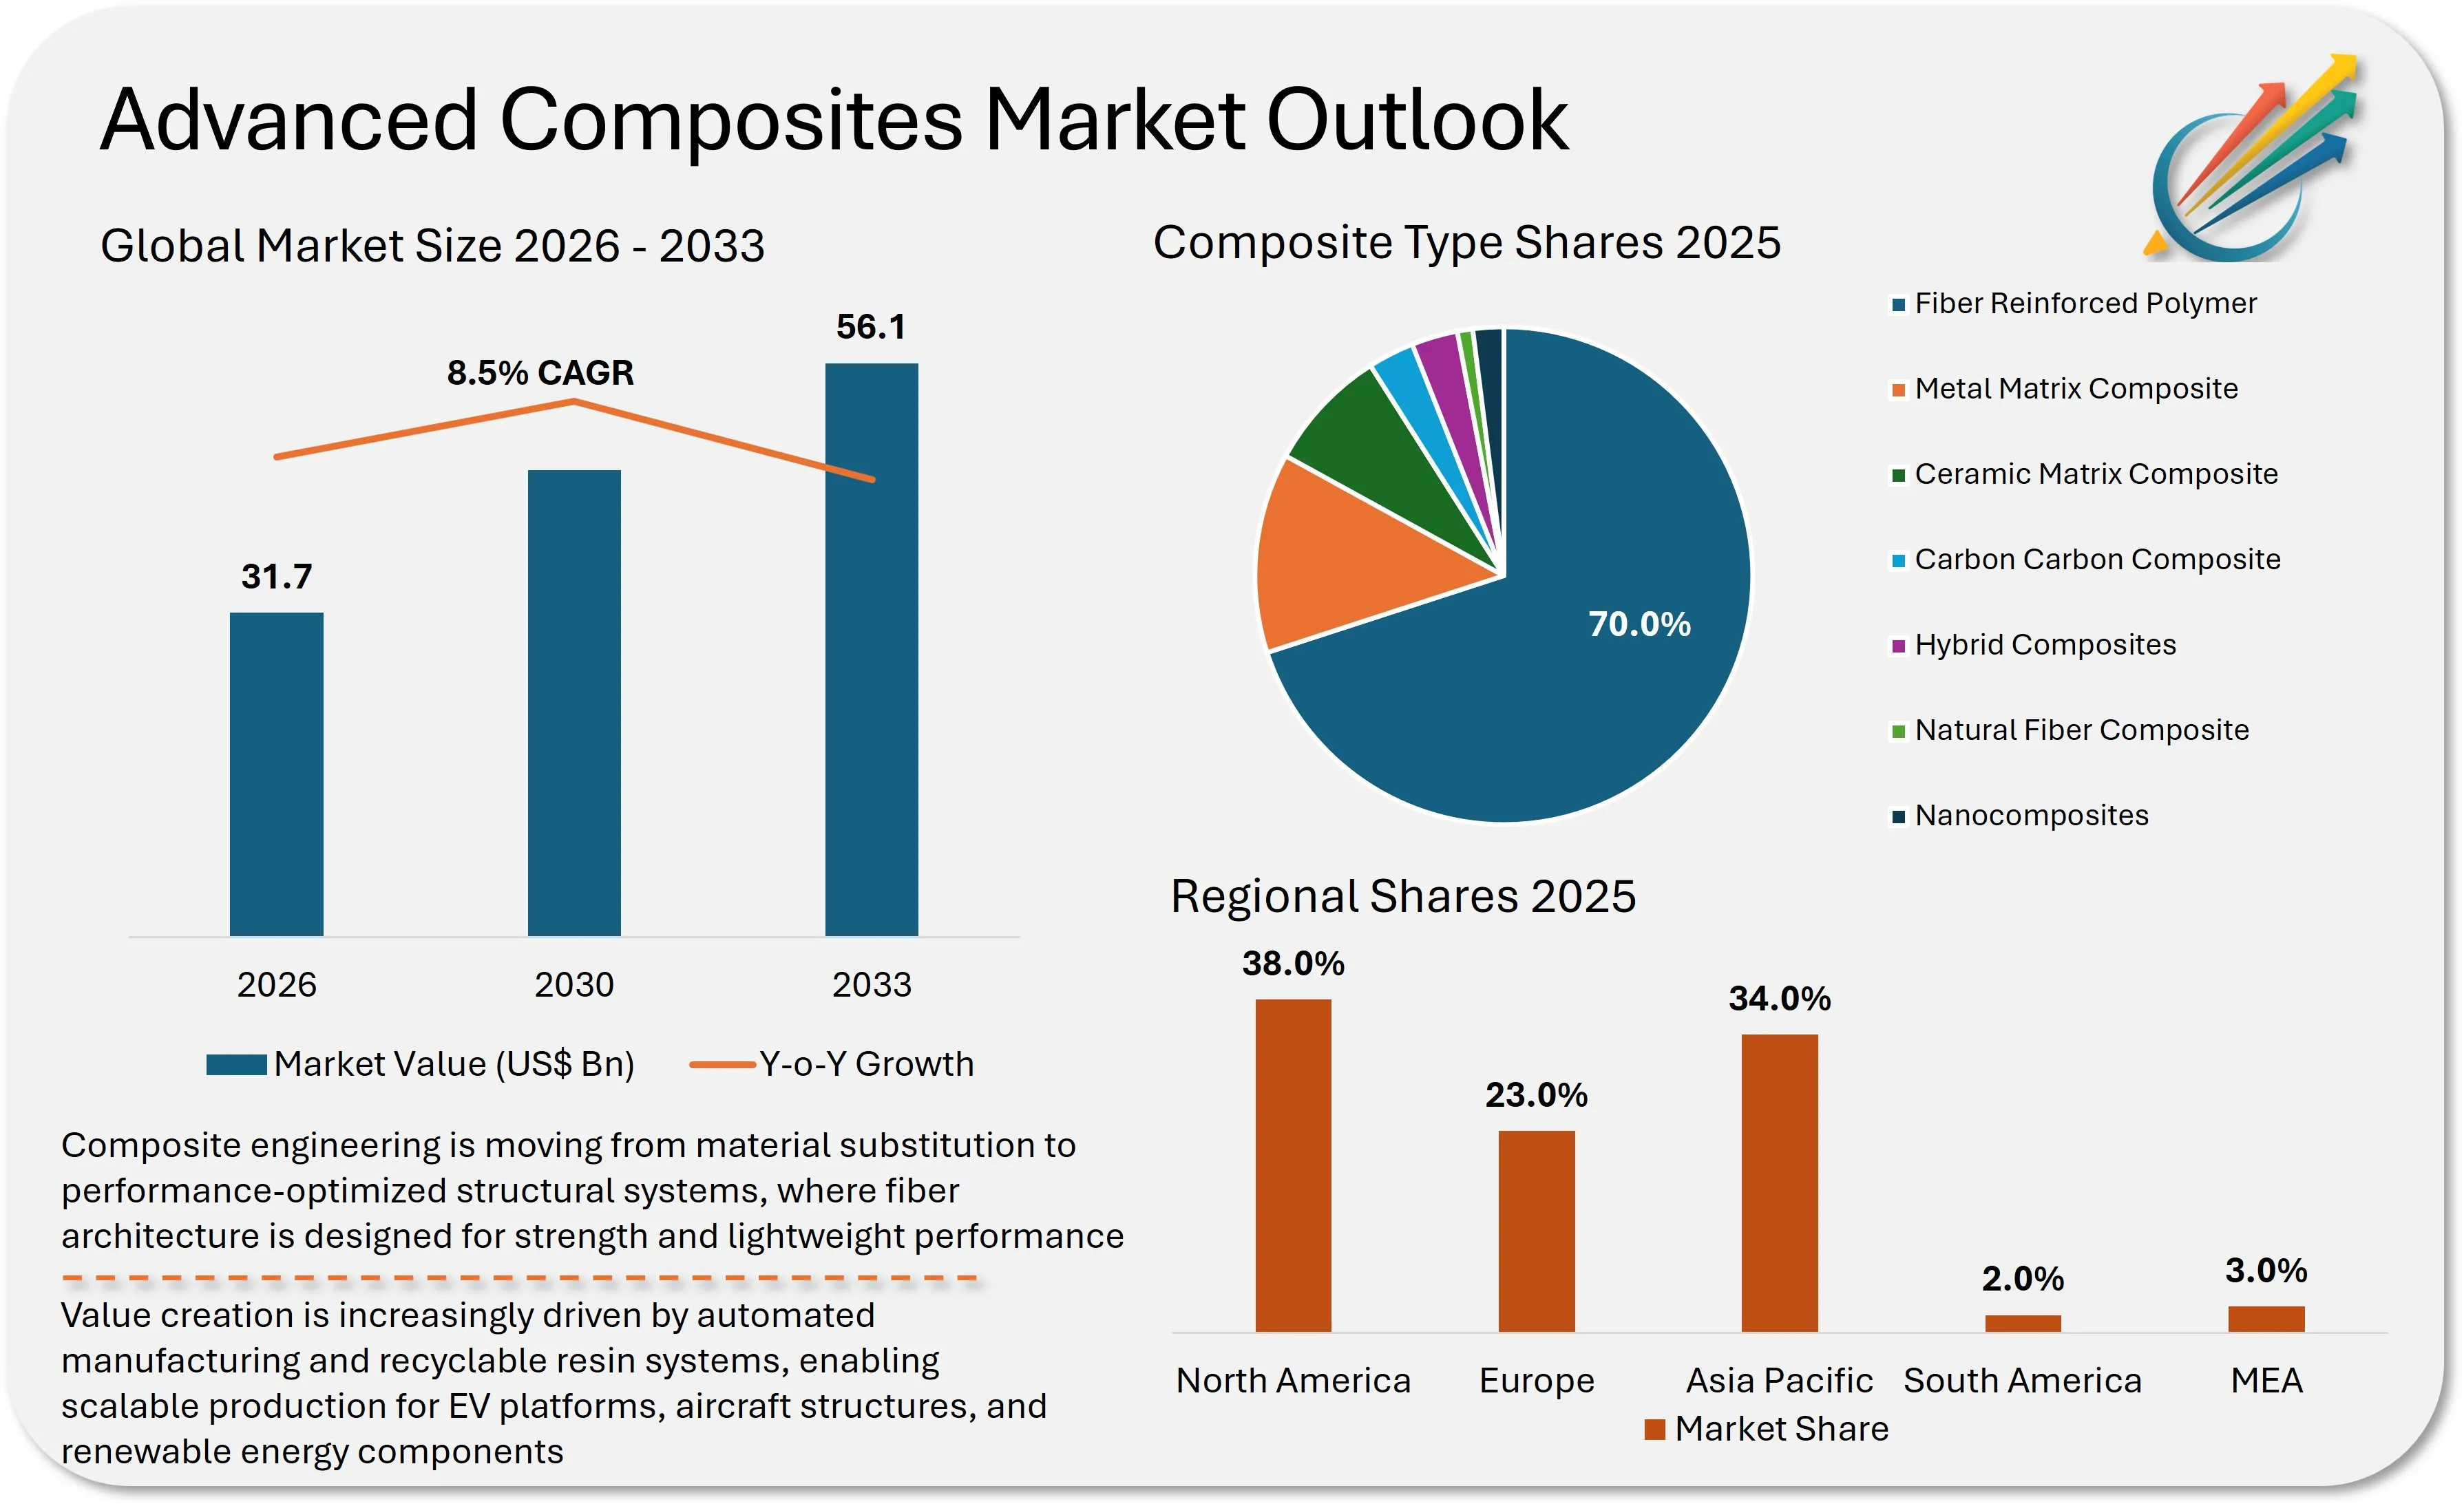
Advanced Composites Market to Reach USD 56.1 Billion by 2033 as Materials Transform Aerospace and EV Design
Manufacturers are accelerating adoption of highstrength lightweight composites to improve fuel efficiency structural performance and sustainability Advanced composites market expanding rapidly as lightweight materials reduce vehicle and aircraft weight by around 3040 Advanced Composites Market Advanced Composites Market Outlook Advanced Composites Market by Key Players Advanced Composites Market Key Players Positioning Matrix Advanced Composites Market Dynamics Advanced Composites Market Dynamics New York NY March 11 2026 GLOBE NEWSWIRE Theadvanced composites market is gaining momentum as enduse industries increasingly demand materials that combine high strength durability and lightweight performance The advanced composites market is estimated to generate a yearly revenue of USD 317 billion in 2026 and is projected to reach USD 561 billion by 2033 witnessing an annualised growth rate of 85 As manufacturers push for zeroemission targets the rapid adoption of thermoplastic resins is revolutionizing highvolume production cycles By embedding highstrength fibers into advanced resins industrial operators are achieving superior stiffness and corrosion resistance The industry is evolving as manufacturers prioritize lightweight design to improve fuel efficiency energy performance emissions reduction etc Aerospace companies are integrating advanced composites into aircraft structures while automotive manufacturers are increasingly adopting them for EVs to offset battery weight Technological advancements in resin systems automated manufacturing processes and recyclable composite materials are reshaping production capabilities As sustainability and performance become core priorities across industries advanced composites are emerging as essential materials for nextgeneration engineering solutions Access the Executive Summary amp Sample Data httpsmarketmindsadvisorycomrequestsamplereportid28105 Key Takeaways from the Advanced Composites Market The advanced composites market is projected to reach USD 561 billion by 2033 growing at 85 CAGR between 2026 and 2033Carbon fiber composites remain a prominent type due to their dominance in aerospace primary structuresThe automated composite manufacturing process is projected to be the fastestgrowing segment during the forecast periodAsiaPacific is emerging as a key investment region driven by massive EV and wind turbine manufacturing scaleRising demand for fireretardant EV battery enclosures is creating new highvolume white spacesGrowing interest in recyclable and biobased composites is reshaping sustainability strategies within the industry Market Dynamics Shaping the Advanced Composites Market Demand for Lightweight and HighPerformance Materials Fostering Advanced Composites Market Increasing demand for lightweight materials across aerospace automotive and renewable energy sectors is driving the advanced composites market Advanced composites offer excellent strengthtoweight ratios enabling manufacturers to design lighter structures without compromising durability In aerospace reducing aircraft weight improves fuel efficiency and operational performance Further EV manufacturers rely on lightweight composite components to offset the additional weight of batteries Wind turbine blades require advanced composites to achieve higher efficiency and durability As industries continue prioritizing performance optimization and energy efficiency the advanced composites market is expected to expand steadily Expanding Applications in EV and Renewable Energy creating Immense Growth Opportunities for Advanced Composites Market Growth in EV production and renewable energy infrastructure is creating ample opportunities for key market players EV manufacturers are increasingly incorporating composite materials in vehicle bodies battery enclosures and structural components to improve energy efficiency and driving range In the renewable energy sector wind turbine blades rely heavily on advanced composites due to their ability to withstand high mechanical stress while remaining lightweight Additionally innovations in recyclable composites and biobased resin systems are opening white spaces aligned with sustainability goals these emerging applications are expanding lucrative business opportunities for advanced composites market participants Request RegionSegmentsSpecific Data Analysis httpsmarketmindsadvisorycomrequestcustomizationreportid28105 Production Costs and Complex Manufacturing Processes Impacting Advanced Composites Market Growth Advanced composites face adoption barriers due to high production costs and complex manufacturing requirements Carbon fiber and specialized resins are substantially more expensive than traditional materials such as steel or aluminum Manufacturing processes including autoclave curing resin transfer molding and filament winding often require specialized equipment and skilled labor These factors increase capital investment and production timelines Moreover recycling and endoflife management of composite materials remain challenging for advanced composites market due to their multimaterial structure Advanced Composites Market Segmentation By Composite Type Fiber Reinforced PolymerMetal Matrix CompositeCeramic Matrix CompositeCarbonCarbon CompositeHybrid CompositesNatural Fiber CompositeNanocomposites Fiber reinforced polymer accounts for majority of sales in advanced composites market owing to their exceptional strengthtoweight ratio and high stiffness properties These materials are used in aerospace structures automotive components highperformance sporting equipment and others Glass fiber composites continue to maintain strong demand because they offer a costeffective alternative for industrial and infrastructure applications As industries seek stronger and lighter materials carbon fiber composites are expected to remain in high demand while complex matrix based composites gain traction in niche applications By Resin Type Epoxy ResinPolyester ResinVinyl EsterPolyimidePolyether Ether Ketone PEEKPolyphenylene Sulfide PPSOthers Epoxy resins account for a key share in the advanced composites market due to their superior mechanical strength chemical resistance excellent adhesion properties etc These resins are widely used in aerospace and wind energy applications where structural performance is critical Polyester resins are commonly used in industrial and marine applications due to their affordability and ease of processing Vinyl ester resins provide improved corrosion resistance making them suitable for chemical and infrastructure applications By Manufacturing Process Hand LayupVacuum Infusion MoldingResin Transfer Molding RTMCompression MoldingPultrusionFilament WindingAutoclave CuringOut of Autoclave ProcessingAutomated Fiber Placement AFP Manufacturing processes play a crucial role in determining the performance and scalability of advanced composite components Resin transfer molding and filament winding are widely used processes due to their efficiency in producing complex structures with consistent quality Pultrusion is commonly applied in the production of continuous composite profiles used in construction and infrastructure applications Automated fiber placement is gaining traction in aerospace manufacturing as it allows precise placement of carbon fibers and reduces production time Increasing automation in the manufacturing is expected to improve scalability and reduce production costs over time and benefiting advanced composites market players By Application Structural ComponentsExterior Body PanelsInterior Trim ComponentsPressure Vessels and TanksFan Blades and RotorsMarine Hulls and SuperstructuresEquipmentOthers Structural components account for a key share in terms of demand due to their extensive use in aerospace and automotive engineering These components require materials that provide high strength and durability while maintaining low weight Interior components in aircraft and vehicles utilize advanced composites for improved design flexibility and weight reduction Pipes and tanks made from composite materials are widely used in industrial sectors due to their corrosion resistance Wind turbine blades represent a rapidly growing application in the advanced composites market as renewable energy installations expand globally requiring large and durable composite structures By Industry Vertical Aerospace and DefenseAutomotive and TransportationWind EnergyMarine and ShipbuildingConstruction and InfrastructureIndustrial Machinery and EquipmentSports and LeisureMedical Devices and HealthcareOil and GasRail and Mass TransitOthers Aerospace and defense sector accounts for a key share of demand for advanced composites as aircraft manufacturers increasingly rely on lightweight materials to improve fuel efficiency and structural performance Automotive manufacturers are also adopting advanced composites in vehicle components to meet emissions regulations and enhance electric vehicle performance Wind energy represents one of the fastestgrowing industry verticals as turbine blades rely heavily on composite materials Construction and marine industries utilize composites for infrastructure and structural applications due to their corrosion resistance and durability and is gaining traction in advanced composites market By Region North AmericaEuropeAsia PacificSouth AmericaMEA North America accounts for a significant share of the advanced composites market due to strong aerospace manufacturing activity in the US and ongoing investments in defense technologies Europe led by Germany France UK and others continues to expand its use of advanced composites in automotive and renewable energy sectors AsiaPacific is emerging as the fastestgrowing region especially in China where industrialization and EV manufacturing are driving demand while Japan continues to lead in premium carbon fiber innovation Secure Full Access to DecisionGrade Data httpsmarketmindsadvisorycombuynowreportid28105 Competitive Landscape Advanced Composites Market The advanced composites market features a mix of global material manufacturers aerospace suppliers and specialized composite technology companies Key market participants are investing in innovation in carbon fiber technologies development of recyclable composite materials strategic partnerships with aerospace and automotive manufacturers Key players are also focusing on acquiring medium size players to bolster their market positions across other regions and to fuel their supply capability by boosting their product portfolio Market players are also investing in automated manufacturing processes and vertical chain integration strategies to improve production efficiency and reduce costs Key Players in Advanced Composites Market are Toray IndustriesTeijin LimitedMitsubishi Chemical CorporationSolvay SAHexcel CorporationSGL Carbon SEGurit Holding AGOwens CorningHuntsman CorporationVictrex plcJushi Group Co LtdKordsa Teknik TekstilSaertex GmbHBASF SEPPG IndustriesSaintGobainRoyal TenCateAxiom MaterialsSIKA AGDuPontDowAksa Advanced CompositesHyosung Key Developments In March 2025 Airbus and Boeing aggressively scaled jet production lines heavily leveraging new thermoplastic composites and fastcuring technologies to enhance manufacturing speed and structural performanceIn June 2025 Dow signed a sale and purchase agreement to divest its 50 stake in DowAksa Advanced Composites Holdings BV to Aksa Akrilik a subsidiary of Akkk HoldingIn 2025 Toray announced the expansion of its South Carolina facility to manufacture defensegrade carbon fiber precursor strengthening its role as a key supplier to the US Department of DefenseIn December 2025 the reintegration of Spirit AeroSystems into Boeing streamlined the aerospace supply chain reducing operational friction for composite fuselage suppliers while putting margin pressure on lowertier vendors Explore the Full Industry Intelligence Suite httpsmarketmindsadvisorycomadvancedcompositesmarket Trending Related Reports The high performance insulation material market is projected to expand remarkably climbing from USD 1443 billion in 2025 to USD 3913 billion by 2035 at a robust CAGR of 12 The global advanced automotive materials market is anticipated to experience robust growth projected to expand at a CAGR of 78 during the forecast period from 2025 to 2035 The advanced polymer composites market is poised for robust expansion driven by increasing demand across aerospace automotive wind energy and construction sectors The automotive composites market is poised for significant growth expanding from USD 93 billion in 2025 to USD 271 billion by 2035 registering a robust CAGR of 131 over the forecast period The high performance composites market is expected to witness substantial growth projected to increase from USD 149 billion in 2025 to USD 378 billion by 2035 at a robust CAGR of 113 during the forecast period The glass fiber reinforced plastic composites market is set to grow substantially with its valuation projected to rise from USD 1954 billion in 2025 to USD 4253 billion by 2035 expanding at a CAGR of 94 during the forecast period The AsiaPacific biocomposites market is set to achieve remarkable growth with its market value projected to rise from USD 87 billion in 2024 to USD 288 billion by 2034 reflecting a robust CAGR of 144 The market of carbon fiber is estimated to be valued at around USD 57 billion in 2026 and is projected to surpass USD 101 billion by 2033 expanding at a CAGR of 87 over the forecast period The carbon fiber composites market is projected to grow significantly rising from USD 2199 billion in 2024 to USD 4041 billion by 2034 with a CAGR of 75 during the forecast period The Recycled Carbon Fiber Market is projected to witness substantial growth reaching an estimated valuation of USD 569 million in 2025 with a robust CAGR of 133 through 2035 Why choose Market Minds Advisory Market Minds Advisory delivers decisiongrade intelligence trusted by executives across machinery amp equipment packaging chemical automotive information amp communication technology food amp beverage consumer goods healthcare and other industries We provide market expansion strategies gotomarket strategies market share acceleration brand positioning analysis and account enablement and growth Our forecasting methodology integrates primary interviews proprietary demand models and continuous market validation to ensure accuracy in volatile and emerging industries With over 10 years of industry experience and insights derived from primary interviews with several industry stakeholders our research provides actionable insights and white space analysis for the emerging segments providing the opportunity gaps in the market accounting recent market developments and geopolitical risks We believe in unlocking growth by helping businesses to see the future of their markets Contact Us Market Minds Advisory 86 Great Portland Street Mayfair London W1W 7FG England United Kingdom T 44 020 3807 7725 Email salesmarketmindsadvisorycom Website httpsmarketmindsadvisorycom LinkedIn Facebook Twitter Instagram Attachments Advanced Composites Market Advanced Composites Market by Key Players Advanced Composites Market Dynamics CONTACT Contact Us Market Minds Advisory 86 Great Portland Street Mayfair London W1W 7FG England United Kingdom T 44 020 3807 7725
Eclipse Automation Marks 25 Years with Strategic Expansion, New Partnerships, and Bold Vision for the Future of Factory Automation
CAMBRIDGE Ontario March 11 2026 GLOBE NEWSWIRE Eclipse Automation a global leader in factory automation today announced a significant strategic evolution in celebration of its 25th anniversary The milestone emphasizes Eclipses renewed focus on global growth innovative partnerships and the continued transformation of modern factories into connected digital and humancentric operations For 25 years Eclipse has helped factories around the world unlock the benefits of factory automation said Steve Mai Chief Executive Officer of Eclipse Automation Today we enter a new era to further the physical and digital convergence helping factory leaders make smarter automation decisions that deliver value faster Mai continued Since its founding in 2001 Eclipse Automation has remained at the forefront of factory automation guiding global manufacturers through rapid technological advancements and we are ready today to guide our clients and partners through this next phase of factory transformation Our teams design and deliver systems the same way our customers evaluate them through an engineering lens for engineers meeting the demands of the Monday morning shift To meet accelerating demand for advanced factory automation and more informed automation decisionmaking Eclipse is expanding its Rock Hill South Carolina facility This increased capacity and engineering capability will better support factory automation advisors and US factory leaders navigating reshoring initiatives As physical automation systems and digital factory strategies rapidly converge from the shop floor to the boardroom Eclipse is focused on helping customers achieve their reshoring objectives with speed scale precision and confidence This move aligns with a growing 1 Trillion USD reshoring opportunity enabling companies to ensure investments deliver longterm operational and economic value as production moves closer to home In Europe Eclipse Automation is strengthening its presence in the life sciences market by launching of a new Sales Business Development and Engineering Applications Hub in Germanybringing the company closer to key customers in one of the worlds most advanced industrial manufacturing regions Advancement of technology is a cornerstone of Eclipse Automation To this regard Eclipse has made an investment in Mirsee Robotics Cambridge Ontario an innovative developer of remotely operated humanoid robotic systems The outcome of this new venture is to combine our resources partner with customers to identify real world use cases and advance the technology for cost effective deployment into production environments A new alliance with NVIDIA will help expedite the digitization of factory data advance the commercialization of digital twins and accelerate the path to softwaredefined AIpowered manufacturing Together these initiatives aim to create a more connected intelligent and resilient factory ecosystem To support these ambitions Eclipse Automation is investing in a new global headquarters purposebuilt for innovation and cocreation The facility will bring together engineers customers and partners in a collaborative environment featuring stateoftheart RampD labs immersive demo spaces and innovation zones dedicated to solving complex manufacturing challenges In a space as dynamic as factory automation strategy cant stand still said Mike Fisher President at Eclipse Automation Our focus is on helping manufacturers think differentlynot just about what they automate but whyso they can align their factory strategy with outcomes that enable them to lead with confidence in a fastchanging landscape This is more than a milestone its a moment of acceleration added Mai Were building the future of factory automation grounded in 25 years of impact and moving forward with greater speed purpose and momentum than ever before About Eclipse AutomationEclipse Automation is a global provider of factory automation solutions with operations across the United States Canada Hungary and Germany With more than 25 years of experience we take great pride in delivering solutions the world depends on We partner with customers throughout the entire automation lifecycle from concept and design to integration and ongoing support helping them combine digital intelligence with physical performance to meet evolving factory demands Our solutions enable factory leaders to improve total cost of ownership increase speed reliability and enhance operational efficiency across a wide range of industries including life sciences electric vehicles automotive battery production heavy machinery nuclear energy consumer goods aerospace and defense and industrial manufacturing We are committed to helping the industry harness the power of digital manufacturing today and into the future Learn more at wwweclipseautomationcom Contact information Jennifer AvrilAccount DirectorBolt PR A Millwright Agencyjavrilboltprcom 9179829012 A photo accompanying this announcement is available at httpswwwglobenewswirecomNewsRoomAttachmentNg0ec9747881e84d748e9128bc5030cb18
CSG and Polska Grupa Zbrojeniowa Launch Multidomain Industrial Partnership
CSG Group and Polska Grupa Zbrojeniowa SA PGZ have signed a Framework Cooperation Agreement that establishes the foundation for further deepening industrial technological and business cooperation The agreement creates a basis for joint development and production projects covering among others engines for the next generation of unmanned systems and missiles the ammunition segment and modern land platforms The document also opens the possibility for joint participation in defence programs implemented within the European Union and NATO The framework agreement was signed in the presence of the Secretary of State at the Polish Ministry of State Assets Konrad Goota and the Ambassador of the Czech Republic to Poland Betislav Dank Cooperation between CSG and PGZ includes among other areas joint work on the design and production of advanced engines intended for use in unmanned systems missile systems and selected land platforms The agreement also envisages a significant expansion of cooperation in the ammunition sector including ammunition for infantry fighting vehicles main battle tanks and tube artillery covering all key calibres essential both for modern armed forces and for Europes production capabilities We support the creation of such alliances within the European Union It is in a way the dual engine that Europe needs This is the time to build smart and responsible alliances with our closest neighbours Our industries declare they are ready to cooperate rather than compete Good cooperation between our defence ministries and industries guarantees that we are building stability and development in the region in a coherent way said Undersecretary of State at the Ministry of State Assets Konrad Goota My mission in Poland is dedicated among other things to cooperation in the field of security I believe we are entering a new phase of cooperation filling political cooperation with tangible content in the key sector of the defence industry CSG and PGZ are very strong partners for building such cooperation said the Ambassador of the Czech Republic to Poland Betislav Dank Both groups also plan to intensify cooperation in the development and production of land platforms particularly in the area of specialized vehicles and heavy mobile support systems The ambition of CSG and PGZ is to create joint competitive technologies that will be able to support national regional and international projects while strengthening the resilience of European supply chains The signed agreement represents a step toward a longterm strategic partnership aimed at addressing the regions growing defence needs and strengthening joint development production and export capabilities It will also include companies belonging to the CSG and PGZ groups The very good cooperation in the implementation of existing projects in the areas of artillery ammunition and land platforms means that we perceive CSG as a trusted partner with very high credibility The RampD and production capabilities of companies belonging to CSG complement the offer of the Polish Armaments Group while the geographical proximity of production facilities in Poland the Czech Republic and Slovakia creates excellent conditions for joint activities These are only some of the reasons why we believe that longterm and multidomain cooperation between PGZ and CSG can become an important factor strengthening the security of our countries and Central Europe said Adam Leszkiewicz President of the Management Board of PGZ SA The combination of technological competencies of companies belonging to CSG and PGZ creates enormous opportunities and can become a source of longterm growth for companies in both groups We are interested in building a longterm partnership that strengthens the security of the European Union and NATO Thanks to strategic cooperation with PGZ we will be able to meet all the requirements of the Polish Ministry of National Defence in terms of the technical modernization of the Polish Armed Forces while also aligning with the economic policy of the Polish government which assumes the localization of production in Poland and the longterm strengthening of the countrys economic base emphasized Wojciech Grzonka Chairman of the Board of CSG Polska and Vice President for Sales at CSG CSG and PGZ are among the largest defence groups in Central Europe and their industrial and technological cooperation has the potential to become a partnership of regional and continental scale The synergies generated by combining the competencies of companies within both groups may effectively support the defence capabilities of armed forces in the region and thus directly strengthen the security of the European Union and NATOs eastern flank The expansion of cooperation between CSG and PGZ aligns with the economic and defence policies of the Czech Republic Slovakia and Poland as well as with the longterm strategy formulated at the European Union level aimed at strengthening the European industrial base building independent and resilient supply chains increasing Europes autonomy in defence and dualuse technologies and improving the interoperability of armed forces An important element included in the agreement is the possibility for CSG and PGZ to establish strategic cooperation in the implementation of international defence projects aimed at strengthening security in the region particularly programs launched by the European Union such as ASAP and SAFE and NATO Cooperation between the two groups will take into account the full range of industrial capabilities of companies belonging to CSG and PGZ The parties to the agreement are CSG companies CSGM as and Czechoslovak Group Polska Sp z oo and Polska Grupa Zbrojeniowa SA The agreement opens the way for expanding the existing cooperation between PGZ and CSG including projects related to the production of ammunition and armoured tactical vehicles In addition in February this year CSG and PGZ established cooperation concerning the integration of the Polish Scatterable Mine System with Tatra chassis and the joint offering of this solution on export markets About CSG CSG NV CSG is a Dutch company and a leading European defence industrial group with its top management headquartered in Prague Czech Republic CSG develops and delivers defence and industrial technologies that contribute to a safer and more stable future The Group focuses on the development and manufacturing of strategically important products systems and technologies in the fields of defence and ammunition as well as in related sectors such as aerospace CSG operates key manufacturing facilities in the United States the United Kingdom Spain Italy Germany the Czech Republic Slovakia Serbia and India and exports its products worldwide The Group continues to invest in the growth of its portfolio companies and the expansion of its core business activities Key companies within the Group include Excalibur Army Czech Republic land systems Tatra Trucks Czech Republic vehicles MSM Group Slovakia artillery ammunition and The Kinetic Group United States smallcalibre ammunition CSG employs more than 14000 people across its integrated and affiliated companies In 2024 the Group reported annual revenues of EUR 40 billion CSG shares are traded on Euronext Amsterdam under the ticker CSG More information is available at wwwczechoslovakgroupcom About CSG Polska CSG has been a longstanding partner of the Polish defence industry in implementing critical programmes related to the technical modernisation of the Polish Armed Forces The development of cooperation on the Polish market is managed by Czechoslovak Group Polska headquartered in Warsaw and established at the end of 2024 Cooperation with Polish companies has so far included technology transfer that enabled the launch of production of 155 mm artillery ammunition for Krab selfpropelled howitzers in facilities belonging to Polska Grupa Zbrojeniowa PGZ Another example of mutually beneficial cooperation with PGZ is the establishment of production of 44 tactical multipurpose vehicles known in Poland as Waran at Huta Stalowa Wola SA and its associated facilities These vehicles are supplied to the Polish Armed Forces in several configurations CSGs offer for the Polish defence industry and the Polish Armed Forces is broad and diverse Among the key principles guiding CSGs activities in Poland are partnership and the pursuit of synergies and longterm business relationships including cooperation on the international defence market with both public and private entities About Polska Grupa Zbrojeniowa SA Polska Grupa Zbrojeniowa is the leader of the Polish defence industry and one of the largest defence groups in Central Europe The Group brings together nearly 70 companies modern industrial plants service facilities and research centres that are crucial to the Polish defence sector PGZs portfolio addresses the full spectrum of needs of modern armed forces and other customers from individual weapons and soldier equipment through communication systems optoelectronics ammunition production radar reconnaissance systems tube artillery specialised transport vehicles and armoured equipment to air and missile defence systems and shipbuilding for naval forces At the same time PGZ possesses comprehensive MRO capabilities More information about PGZ can be found at httpsgrupapgzpl CSG Press Office Andrej rtek Spokesperson tel 420 602 494 208 email andrejcirtekczechoslovakgroupcz PGZ SA Communication and External Relations Office Artur Weber tel 48 539 671 974 email arturweberpgzsapl Attachments PR CSG and Polska Grupa Zbrojeniowa Launch Multidomain Industrial Partnership PR CSG and Polska Grupa Zbrojeniowa Launch Multidomain Industrial Partnership
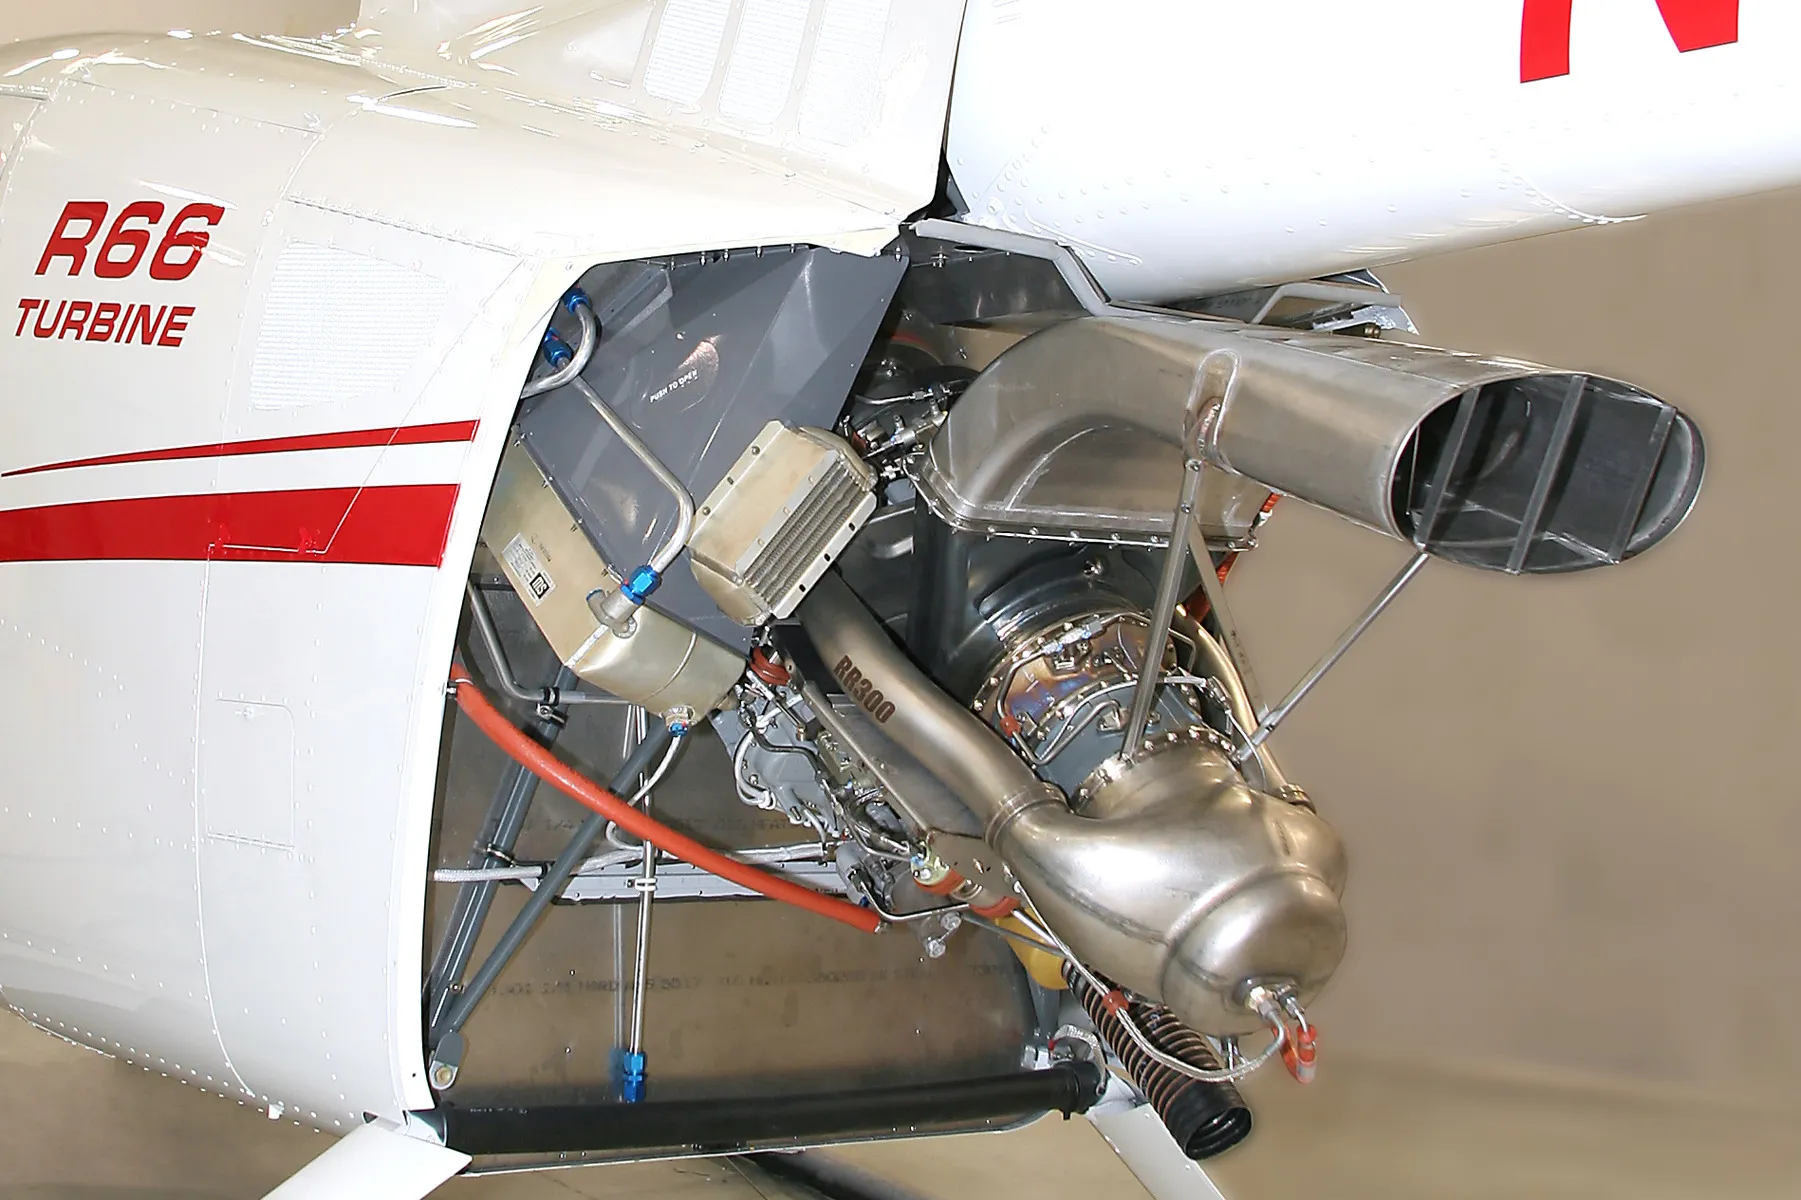
Predictable Power: StandardAero Selected by Robinson Helicopter Company as Preferred MRO Provider for R66 Rolls-Royce RR300 Engines
Robinson R66 owners gain enhanced service reliability and costcontrol with StandardAero R66 RollsRoyce RR300 StandardAero selected as preferred MRO provider for R66 RollsRoyce RR300 engines SCOTTSDALE Ariz and TORRANCE Calif March 11 2026 GLOBE NEWSWIRE StandardAero NYSE SARO a leading independent pureplay provider of aerospace engine aftermarket services including engine maintenance repair and overhaul MRO and engine component repair has been selected by US helicopter OEMRobinson Helicopter Company to support their global fleet of R66 helicopters powered by the RollsRoyce RR300 engine This relationship will provide R66 helicopter owners and operators with a Robinsonrecommended MRO solution for abbreviated turnaround times and reduced costs The new agreement secures immediate shop capacity and establishes turnaround time commitments to minimize operational downtime StandardAero currently holds 150 approved component repairs on the RR300 and is proactively developing an additional 180 repairs to help reduce part replacement costs We are excited to work with Robinson and their network of Service Centers to provide reliable engine support to their operator base said Ray Franczuk Interim Vice President and General Manager for StandardAeros Helicopters business Our OEMaligned technical expertise allows us to keep quality and reliability at the forefront of our service offering We have been able to leverage our 60 years of experience on the RollsRoyce M250 to bolster available RR300 repairs and reduce costly component replacement whenever possible To further accelerate returntoservice we maintain a robust exchange pool designed specifically to support timecritical requirements We look forward to delivering R66 operators maintenance solutions that enable operational continuity and lower cost of ownership without compromising safety or reliability This agreement addressesone of the largestchallenges our customers face unpredictable engineoverhaulcosts and turnaround times said David Smith president and CEO of Robinson Helicopter Company Increasing overhaulcostsand extended downtime directly impact our operators profitability and their ability to maintain consistent flight schedules By securing predictable turnaround times for the 2000hour and 4000hour PMI events we are providing the predictabilityour customers needto managetheirbusiness effectively Operationally the collaboration integrates demand forecasting and material planning to improve parts availability and readiness Services will be localized across four primary StandardAero hubs in North America and the United Kingdom including Winnipeg Manitoba and Richmond British Columbia Canada Concord North Carolina in the US and Hampshire in England By aligning capacity management with lifecycle support both companies aim to provide operators around the world with greater predictability and more streamlined technical oversight for their engine assetsThe Robinson R66 is a versatile light turbine helicopter used globally for a variety of missions including flight training utility public and para public missions StandardAerois a leading independent pureplay provider of aerospace engine aftermarket services for fixed and rotarywing aircraft serving the commercial military and business aviation end markets StandardAero provides a comprehensive suite of critical valueadded aftermarket solutions including engine maintenance repair and overhaul engine component repair onwing and field service support asset management and engineering solutions StandardAero is an NYSE listed company under the ticker symbol SARO For more information about StandardAero go towwwstandardaerocom ABOUT ROBINSON HELICOPTER COMPANYFor more than 50 years Robinson Helicopter Company has focused on making helicopter missions accessible reliable and safe By maintaining a vertically integrated manufacturing foundation in the United States Robinson provides global operators with practical tools for modern missions From its topselling R22 R44 R66 helicopters to an expanding portfolio including the 10seat R88 With the addition of its new business unit Robinson Unmanned the company offers both small and large autonomous and remotely piloted aircraft UAS for civil commercial or defense missions Robinson is committed to developing manufacturing and supporting the most reliable and efficient helicopters in the industry Learn more at wwwrobinsonhelicom and wwwRobinsonUnmannedcom StandardAero Media ContactJake Saylor VP Marketing amp Communications1 6022091029JakeSaylorstandrdaerocom StandardAero Investor ContactRama Bondada VP Investor Relations1 4803773196Ramabondadastandardaerocom Robinson Helicopter ContactRobyn Eagles VP Global Marketing amp Communications1 3235475102robyneaglesrobinsonhelicom A photo accompanying this announcement is available at httpswwwglobenewswirecomNewsRoomAttachmentNg4f40e830eea4484d9cd922148756c2f6
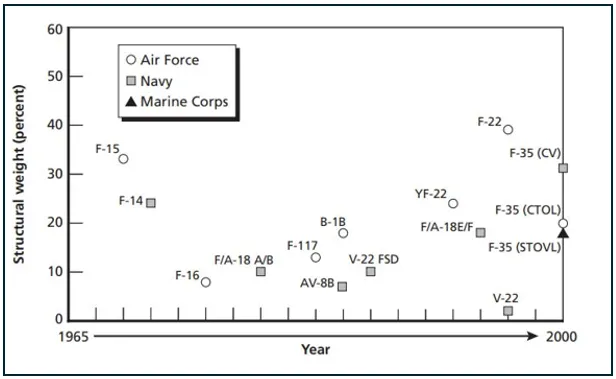
SAGA Metals Highlights Radar Project’s Strategic Relevance to North American Titanium and Vanadium Supply Chains Amid Heightened National Defense and Critical Minerals Focus
Radar Project has confirmed mineralization in 31 of 31 drill holes with consistent grades and thicknesses and assays reporting up to 6455 Fe2O3133 TiO2 and 066 V2O5 VANCOUVER British Columbia March 10 2026 GLOBE NEWSWIRE SAGA Metals Corp SAGA or the Company TSXV SAGA OTCQB SAGMF FSE 20H a North American exploration company focused on critical mineral discoveries highlights the strategic relevance of its 100 owned Radar Critical Minerals Project in Labrador Canada amid increasing North American focus on securing domestic and allied supply chains for titanium and vanadium two minerals recognized for their importance in aerospace defense and advanced industrial applications The USA and Canadas critical minerals policy identifies both titanium and vanadium as critical minerals 12 and Canada has stated that the CanadaUS Joint Action Plan on Critical Minerals is intended to help secure supply chains for strategic manufacturing sectors including aerospace and defense 2 The Companys comments follow its March 5 2026 news release reporting assay intercepts from 2026 drilling at the Trapper South Zone including 1 Hole R0016 5060 m 5205 FeO 721 TiO 0375 VO2 Hole R0017 9001 m 5186 FeO 676 TiO 0417 VO These drill intercepts are part of SAGAs ongoing maiden mineral resource estimate drill program at its Radar Critical Minerals Project focused on the discovery of Titanium Vanadium and Iron Ore SAGA has completed and confirmed mineralization in 31 out of 31 drill holes with consistent grades and thicknessesand assays reporting up to6455 Fe2O3133 TiO2 and 066 V2O5 Radar is being advanced against a backdrop of growing strategic focus on North American critical mineral security said Michael Stier CEO of SAGA Titanium and vanadium are increasingly recognized for their relevance to aerospace defense and highperformance industrial applications As we continue to define the scale and continuity of mineralization at Radar we believe the project has the potential to become an important Canadian exploration story tied to the longterm need for secure North American supply of these critical defense metals Titanium is an important raw material for a significant portion of the structural weight of many military airframes It offers an excellent set of properties a high strengthtoweight ratio high strength at high temperatures corrosion resistance and thermal stability making it ideal for airframe structures Titanium sponge production is concentrated in China Russia and Japan raising concerns about the North American supply Figure 1 Percentage of Titanium in the Structural Weight of Selected Military Aircraft Source Younossi Kennedy and Graser 2001 updated with recent F22 and F35 information US defense and national security policy has long identified titanium and vanadium as strategically important materials Under current US law titanium and titanium alloys are specifically included within the Department of Defense DoD specialty metals regime 3 In addition the US Defense Logistics Agency identifies vanadium as used in steel and in titaniumaluminumvanadium alloys in jet engines and highspeed aircraft 4 DoD has also funded domestic titanium capacity including a 2023 award of 127 million to increase titanium powder production for defense supply chains 5 Among modern aircraft built in the last two decades stealth fighters dominate titanium consumption with the F22 and F35 using some of the highest proportions ever seen in production combat aircraft Recent events have further underscored the urgency around North American critical mineral security On March 4 2026 Reuters reported that the Pentagon had asked members of the Defense Industrial Base Consortium for proposals related to the mining processing or recycling of 13 critical minerals including vanadium with potential project funding ranging from US100 million to more than US500 million 6 Reuters also reported that the Defense Logistics Agency had separately sought market information relating to additional metals for potential stockpile activity reinforcing the broader US push to expand access to strategic materials tied to defense and industrial resilience 7 In parallel recent market commentary published by MININGcom citing a Sprott report highlighted that critical minerals are increasingly being valued for their strategic importance to national security electrification and infrastructure contributing to what it described as an emerging commodity Supercycle 8 SAGA believes its Radar Project is emerging at a time when governments across North America are increasingly focused on domestic and allied sources of critical mineral inputs required for advanced manufacturing resilient supply chains and national defense readiness The Company believes Radars location and infrastructure including road access deepwater port nearby hydroelectric power and airstrip in Labrador may offer a compelling jurisdictional advantage as North American governments and manufacturers continue to prioritize stable transparent and allied sources of strategic mineral inputs The US government has likewise identified Vanadium as essential to national security because of its use in steel and titanium alloys for defense and aerospace applications In its Section 232 vanadium report the US Department of Commerce stated that vanadium is required for national defense systems and recommended support for domestic vanadium production as well as the readdition of vanadium pentoxide to the National Defense Stockpile 9 SAGAs Radar Critical Minerals Project is currently an explorationstage project and the Company believes the growing body of drill results supports continued evaluation of Radar as a potential future source of titanium and vanadiumbearing mineralization within a jurisdiction increasingly relevant to North American supply chain resilience SAGA is continuing its 2026 drilling and geological evaluation programs at the Trapper Zone as it advances toward a Maiden Mineral Resource Estimate MRE As reported on March 5 2026 the Company had completed 16 drill holes totalling 3435 metres at Trapper South in 2026 with additional assays pending About the Radar Critical Mineral Property in Labrador The Radar Property spans 24175 hectares and hosts the entire Dykes River intrusive complex about 160 km a unique position among Western explorers Geological mapping geophysics and trenching have already confirmed oxide layering across more than 20 km of strike length with mineralization open for expansion Figure 2Radar Property map depicting magnetic anomalies oxide layering and the site of the 2025 drill programs The Property is well serviced by road access and is conveniently located near the town of Cartwright Labrador A compilation of historical aeromagnetic anomalies is overlaid with groundbased geophysical data as shown Vanadiferous titanomagnetite VTM mineralization at Radar is comparable to global FeTiV systems such as Panzhihua China Bushveld South Africa and Tellnes Norway positioning the Project as a potential strategic future supplier of titanium vanadium and iron to North American markets Figure 3Radar Projects prospective oxide layering zone validated over about 16 km strike length through drilling as shown on a compilation of historical airborne geophysics as well as groundbased geophysics in the Hawkeye and Trapper zones completed by SAGA SAGA has demonstratedthe reliability of the regional airborne magnetic surveys after groundtruthing and drillingin the 2024 and 2025 field programs Radar Project Highlights Confirmed mineralization in 31 out of 31 drill holes completed and observed in two primary zones to dateInfrastructure including road access deepwater port nearby hydroelectric power and airstripConfirmed the16 km oxide layering trendthat stretches from the Hawkeye Zone to the Trapper ZoneConsistent grades and thicknesseswith semimassive to massive oxide reporting up to6455 Fe133 TiO2 and 066 V2O5Petrographic analysis confirms titanomagnetite mineralization is advantageous forsimplified metallurgical processingAnalytical results have been obtained for the first two 2diamond drill holesof the MRE drill program reinitiated in 2026 with top intercepts including Hole R00165060 m 5205 FeO 721 TiO 0375 VOHole R00179001 m 5186 FeO 676 TiO 0417 VO Completed sixteen 16 holes R0016 to R0031 to date in 2026 with significantoxide intercepts up to 15477 m R0026 predominantly semimassive oxide with extensive rhythmic layeringMultiple holes intercepted broad zones ofsemimassive oxide up to 8708 m confirming increased oxide concentration and thickness in the southeastern anomalyRhythmic banding and semimassive to massive oxidemineralization observed consistently aligning with prior highgrade results from Trapper NorthDrilling is progressing efficiently with3435 m already completed in 2026 Hole R0032 is in progressIGS has received 350 samples from R0018 0019 and 0020 Assays are expected within a week Qualified PersonPaul J McGuigan P Geo is an Independent Qualified Person as defined under National Instrument 43101 and has reviewed and approved the technical information disclosed in this news release Sources httpswwwcanadacaencampaigncriticalmineralsincanadacriticalmineralsanopportunityforcanadahtmlhttpswwwcanadacaencampaigncriticalmineralsincanadacanadiancriticalmineralsstrategyhtmlhttpswwwgovinfogovlinkuscode104863httpswwwdlamilStrategicMaterialsMaterialshttpswwwdefensegovNewsReleasesReleaseArticle3573402dodawards127milliontoincreasetitaniumpowderproductionfordefensesupplhttpswwwreuterscomworlduspentagonsoughtfreshsupply13criticalmineralsdaybeforeiranattack20260304httpswwwminingcomwebusdefensedepartmentseeksinformationtoexpandmetalstockpileshttpswwwminingcomcriticalmineralsdrivenewcommoditysupercyclesprotthttpswwwgovinfogovcontentpkgFR20211118pdf202124957pdf About SAGA Metals Corp SAGA Metals Corp is a North American mining company focused on the exploration and discovery of a diversified suite of critical minerals that support the North American transition to supply security The Radar TiVFe Project comprises 24175 hectares and entirely encloses the Dykes River intrusive complex mapped at 160 km on the surface near Cartwright Labrador Exploration to date including 4250 m of drilling has confirmed a large mineralized layered mafic intrusion hosting vanadiferous titanomagnetite VTM and ilmenite mineralization with strong grades of titanium and vanadium The Double Mer Uranium Project also in Labrador covers 25600 hectares and features uranium radiometrics that highlight an 18km eastwest trend with a confirmed 14km section producing samples as high as 0428 U3O8 Uranium uranophane was identified in several areas of highest radiometric response 2024 Double Mer Technical Report Additionally SAGA owns the Legacy Lithium Property in Quebecs Eeyou Istchee James Bay region This project developed in partnership with Rio Tinto has been expanded through the acquisition of the Amirault Lithium Project Together these properties cover 65849 hectares and share significant geological continuity with other major players in the area including Rio Tinto Winsome Resources Azimut Exploration and Loyal Metals With a portfolio spanning key commodities critical to the clean energy future SAGA is strategically positioned to play an essential role in securing critical minerals On Behalf of the Board of Directors Mike Stier Chief Executive Officer For more information contact Rob Guzman Investor RelationsSAGA Metals CorpTel 1 844 7242638Email robsagametalscomwwwsagametalscom Neither the TSX Venture Exchange nor its Regulation Service Provider as that term is defined in the policies of the TSX Venture Exchange accepts responsibility for the adequacy or accuracy of this release Cautionary DisclaimerThis news release contains forwardlooking statements within the meaning of applicable securities laws that are not historical facts Forwardlooking statements are often identified by terms such as will may should anticipates expects believes and similar expressions or the negative of these words or other comparable terminology All statements other than statements of historical fact included in this release are forwardlooking statements that involve risks and uncertainties In particular this news release contains forwardlooking information pertaining to the Companys Radar Project and its potential relation to the broader industry and macro trends There can be no assurance that such statements will prove to be accurate and actual results and future events could differ materially from those anticipated in such statements Important factors that could cause actual results to differ materially from the Companys expectations include but are not limited to changes in the state of equity and debt markets fluctuations in commodity prices delays in obtaining required regulatory or governmental approvals environmental risks limitations on insurance coverage inherent risks and uncertainties involved in the mineral exploration and development industry particularly given the earlystage nature of the Companys assets and the risks detailed in the Companys continuous disclosure filings with securities regulations from time to time available under its SEDAR profile at wwwsedarplusca The reader is cautioned that assumptions used in the preparation of any forwardlooking information may prove to be incorrect Events or circumstances may cause actual results to differ materially from those predicted as a result of numerous known and unknown risks uncertainties and other factors many of which are beyond the control of the Company The reader is cautioned not to place undue reliance on any forwardlooking information Such information although considered reasonable by management at the time of preparation may prove to be incorrect and actual results may differ materially from those anticipated This cautionary statement expressly qualifies forwardlooking statements contained in this news release The forwardlooking statements contained in this news release are made as of the date of this news release and the Company will update or revise publicly any of the included forwardlooking statements only as expressly required by applicable law Photos accompanying this announcement are available at httpswwwglobenewswirecomNewsRoomAttachmentNgf1f7162a25524903bcb02f4718c8b3cb httpswwwglobenewswirecomNewsRoomAttachmentNg8350e4156ea046f0916c9c44c0681537 httpswwwglobenewswirecomNewsRoomAttachmentNga358ac2bdaf140a9a208d80d7b6445ed

Karas Plating Invests £1.5 Million in Automated Silver-Plating Line to Expand Capacity for Advanced Manufacturing
Exploring the Unsung Hero of the UKs Manufacturing SectorLeigh GREATER MANCHESTER March 06 2026 GLOBE NEWSWIRE Karas Plating a UKbased metal finishing specialist announced today the installation of a 15 million fully automated silverplating line designed to expand production capacity and support growing demand from advanced manufacturing sectors The new system provides what the company states is the widest dimensional capacity for silver plating in the UK and Europe enabling manufacturers across industries such as aerospace defence electronics and data infrastructure to access enhanced surface engineering capabilities Electroplating often overlooked is a small but critical link in the supply chain one whose absence would bring entire industries to a grinding halt The process involves coating a metal object with a thin layer of another metal through electrochemical deposition enhancing durability conductivity and corrosion resistance across a vast range of components From defence and aerospace to the rapidly expanding data centre sector the applications of electroplating are indispensable to the UKs sovereign industrial capabilities Alan Pennington CEO of Karas Plating emphasises the significance of this process Electroplating is the unsung hero of manufacturing It is a critical component that ensures the longevity and performance of products that people rely on every day At Karas Plating we are proud to contribute to the backbone of Britains manufacturing sector by delivering tailored solutions that meet the specific needs of our clients Karas Platings commitment to quality and innovation has positioned it as a leader in the metal finishing industry The company offers a range of plating options including silver gold nickel tin and zinc each selected to meet the unique requirements of different applications Most notably Karas Plating recently invested more than 15 million in a fully automatic marketleading silverplating line and now offers the widest dimensional capacity of any silverplating operation in the UK and Europe This investment underscores the companys dedication to delivering superior results for its clients and reflects the growing demand for advanced surface engineering solutions across advanced manufacturing sectors The importance of electroplating extends far beyond aesthetics It plays a vital role in improving the efficiency and reliability of components across some of the most demanding industries in the world Karas Plating serves customers across automotive defence electronics electric vehicles Formula One solar energy and space as well as the booming data centre industry where electroplating is proving critical to meeting the sectors rapid expansion and the exacting conductivity requirements it demands As the manufacturing landscape continues to evolve the demand for precise metal finishing solutions is expected to grow Karas Plating remains committed to staying at the cutting edge of technology and innovation ensuring that its clients receive the best possible service and results The companys dedication to excellence not only supports the manufacturing sector but also contributes to the broader economic resilience and sovereign capabilities of the UK Press Inquiries Alan Pennington enquiries at karascouk 0333 121 0151 httpskarascouk Brooklands Mill English Street Leigh Greater Manchester WN7 3EH
Syensqo fourth quarter and full year 2025 results
Press releaseCommuniqu de pressePersbericht Syensqo fourth quarter and full year 2025 results Full year free cash flow of 356 million above prior outlook Pro forma full year underlying EBITDA of 121 billion with resilient margin performance 4 full year net sales growth in Composite Materials supported by strong Q4 Brussels February 26 2026 700am CET Q4 2025 Highlights1 Net sales of 142 billion impacted by yearonyear foreign exchange movements 6 and lower volumes 5 while pricing remained stable Composite Materials delivered 11 yearonyear organic growthGross profit of 397 million decreased by 18 from the prior year primarily due to lower volumes and unfavorable currency effects resulting in a gross margin of 28Underlying EBITDA of 238 million decreased 17 organically yearonyear primarily due to lower underlying EBITDA in Specialty Polymers and Technology Solutions partially offset by structural cost savings and strong growth in Composite MaterialsUnderlying EBITDA margin of 17 contracted 230 basis points yearonyear organically primarily due to lower volumes in Specialty Polymers partially offset by structural cost savings Underlying profit attributable to Syensqo shareholders of 31 millionOperating cash flow of 252 million Free cash flow of 136 million supported by cash inflows from working capital and lower yearonyear capital expenditures FY 2025 Highlights Net sales of 614 billion impacted by yearonyear foreign exchange movements 3 and lower volumes 3 while pricing remained stable Composite Materials delivered 4 yearonyear organic growthGross profit of 1901 million decreased by 14 yearonyear primarily driven by lower volumes and unfavorable foreign exchange movements resulting in gross margin of 31Underlying EBITDA of 1210 million decreased by 12 yearonyear organically primarily due to lower underlying EBITDA in Specialty Polymers and Novecare partially offset by structural cost savings Underlying EBITDA margin of 20 declined by 210 basis points yearonyear organically primarily due to lower volumes in Specialty Polymers partially offset by structural cost savingsUnderlying profit attributable to Syensqo shareholders of 381 millionOperating cash flow of 779 million Free cash flow of 356 million supported by the absence of the 167 million payment to the NJDEP lower yearonyear capital expenditure and working capital inflows Increased cash returns to shareholders c1687000 shares repurchased or c116 million Dividend for 2025 of 162 payout ratio of 44 will be proposed to the 2026 Annual General Meeting by the Board of DirectorsCompleted the divestment of the Oil amp Gas business unit in January 2026 for an enterprise value of 135 million or c7x EVEBITDA advancing the companys pure play specialty strategy Pro forma results including discontinued operations Pro forma incl Oil amp Gas 1Q4 2025Q4 2024Q3 2025YoY changeYoY organicQoQ changeFY 2025FY 2024YoY changeYoY organicNet sales1418159815171135665614065636532Gross profit39748248417618019012219143Gross profit margin280302319220 bps390 bps310338280 bpsUnderlying EBITDA23829832620217227212101412143124Underlying EBITDA margin168186215190 bps230 bps480 bps197215180 bps210 bpsOperating cash flow252345331270nm77984174Free cash flow136159250145nm356223596Cash conversion LTM767176550 bps10 bps7671550 bpsROCE LTM637965160 bps20 bps6379160 bps 1 Highlights are based on Pro forma figures including Oil amp Gas consistent with prior outlook For regulated information as per Article 11 of the Royal Decree of 14 November 2007 we refer to the financial report published on February 26 2026 which is available on Syensqos website Mike Radossich CEO 2025 was a year of resilient cash generation and margin performance in a challenging demand environment These foundations provide a strong platform from which to build As the new CEO my top priority is to define and start to implement the actions to drive and ultimately accelerate our growth My mandate is clear to accelerate value creation We are moving with urgency sharpening execution and capital discipline as well as strengthening our conversion of innovation to growth We are investing to further improve our delivery and I see multiple opportunities to drive our longerterm performance Over the course of the year I plan to progressively provide updates on the refreshed framework and actions that will underpin our next phase of growth 2026 Outlook For 2026 we expect macroeconomic and demand uncertainty to continue across most of our end markets In this context our priority will be executing on actions within our control to both accelerate volume growth and increase cashflow Contemplated in our outlook is the assumption for current demand trends to continue and the absence of a broader recovery throughout the year Overall we expect low singledigit volume growth in 2026 with Composite Materials leading the improvement underpinned by strong demand from customers in civil aerospace as well as our diverse range of customer programs and applications For Specialty Polymers we expect volume growth to be modestly higher driven by growth in the automotive end market This is expected to be offset by lower volumes in Consumer Electronics due to lower sales and an unfavorable product mix at a major customer as well as the planned phaseout of certain products aligned with our nonfluorosurfactant strategy Together these two headwinds are expected to have an approximately 30 million impact to yearonyear underlying EBITDA For semiconductors while visibility remains challenging we expect a gradual recovery in yearonyear volumes resulting in stronger growth in the second half of the year Nevertheless this remains a key growth driver supported by our market position customer exposures and leveraging the longerterm secular trends in advanced connectivity and AIrelated demand For Novecare we expect low single digit volume growth driven by Agro and Home amp Personal Care partially offset by modestly lower pricing For Technology Solutions we expect low to mid single digit volume growth in mining solutions including the impact of the temporary closure of a customer mine in Indonesia which is expected to be a yearonyear headwind in the first half of 2026 We expect gross margin across our four core global business units Specialty Polymers Composite Materials Novecare and Technology Solutions to remain broadly stable compared to 2025 demonstrating our strong value proposition and specialty positioning Following the completion of the divestment of the Oil amp Gas business in early January we are progressing with the planned divestment of Aroma and expect to provide an update around the end of the second quarter Supporting our profitability we remain on track to deliver on our cost savings program which targets to deliver more than 200 million of run rate savings by the end of 2026 For the full year we expect cost savings to offset inflationary impacts on fixed and variable costs Finally our outlook includes the impact of foreign exchange movements relative to the Euro which we expect to have an approximately 40 million yearonyear headwind to underlying EBITDA in 2026 On a full year basis excluding the recently divested Oil amp Gas business unit our outlook is as follows Underlying EBITDA2 of approximately 11 billion compared to 1143 billion in 2025Operating cash flow of approximately 700 million compared to 7794m in 2025Capital Expenditures5 of less than 500 million compared to 5634m in 2025 2 Assumes EURUS 120 compared to 113 in FY 20253 At constant currency and scope4 Including Discontinued Operations5 Includes c 50 million of capital expenditures related to the new ERP implementation More detailed information on the full year 2025 results available on the website Safe harborThis press release may contain forwardlooking information Forwardlooking statements describe expectations plans strategies goals future events or intentions The achievement of forwardlooking statements contained in this press release is subject to risks and uncertainties relating to a number of factors including general economic factors interest rate and foreign currency exchange rate fluctuations changing market conditions product competition the nature of product development impact of acquisitions and divestitures restructurings products withdrawals regulatory approval processes allin scenario of RampI projects and other unusual items Consequently actual results or future events may differ materially from those expressed or implied by such forwardlooking statements Should known or unknown risks or uncertainties materialize or should our assumptions prove inaccurate actual results could vary materially from those anticipated The Company undertakes no obligation to publicly update or revise any forwardlooking statements About SyensqoSyensqo is a science company developing groundbreaking solutions that enhance the way we live work travel and play Inspired by the scientific councils which Ernest Solvay initiated in 1911 we bring great minds together to push the limits of science and innovation for the benefit of our customers with a diverse global team of more than 13000 associates in 30 countriesOur solutions contribute to safer cleaner and more sustainable products found in homes food and consumer goods planes cars batteries smart devices and health care applications Our innovation power enables us to deliver on the ambition of a circular economy and explore breakthrough technologies that advance humanityLearn more at wwwsyensqocom Rsultats du quatrime trimestre et de lanne 2025 de Syensqo Free cash flow annuel de 356 millions deuros suprieur aux perspectives prcdentes EBITDA sousjacent pro forma annuel de 121 milliard deuros avec une marge rsiliente Croissance annuelle de 4 du chiffre daffaires net de Composite Materials soutenue par un T4 solide Bruxelles 26 fvrier 2026 700 CET Faits marquants T4 20251 Chiffre daffaires net de 142 milliard impact par des effets de change dfavorables dune anne sur lautre 6 et des volumes plus faibles 5 tandis que les prix sont rests stables Composite Materials a enregistr une croissance organique de 11 en glissement annuelMarge brute de 397 millions en baisse de 18 dune anne sur lautre principalement en raison de volumes plus faibles et deffets de change dfavorables ce qui se traduit par une marge brute de 28EBITDA sousjacent de 238 millions en baisse organique de 17 en glissement annuel principalement en raison dun EBITDA sousjacent plus faible dans Specialty Polymers et Technology Solutions partiellement compens par des conomies de cots structurelles et la forte croissance de Composite MaterialsLa marge dEBITDA sousjacente 17 sest contracte de 230 points de base en glissement annuel sur une base organique principalement en raison de volumes plus faibles dans Specialty Polymers partiellement compenss par des conomies de cots structurellesLe rsultat net sousjacent attribuable aux actionnaires de Syensqo slve 31 millions deurosCash flow oprationnel de 252 millions Free cash flow de 136 millions soutenu par des entres de trsorerie lies au fonds de roulement et par des dpenses dinvestissement infrieures celles de lexercice prcdent Faits marquants anne 2025 Chiffre daffaires net de 614 milliard impact par des effets de change dfavorables dune anne sur lautre 3 et des volumes plus faibles 3 Composite Materials a enregistr une croissance organique de 4 en glissement annuelMarge brute de 1901 millions en baisse de 14 dune anne sur lautre principalement en raison de volumes plus faibles et deffets de change dfavorables ce qui se traduit par une marge brute de 31EBITDA sousjacent de 1210 millions en baisse organique de 12 en glissement annuel principalement en raison dun EBITDA sousjacent plus faible dans Specialty Polymers et Novecare partiellement compens par des conomies de cots structurellesLa marge dEBITDA sousjacent 20 sest contracte de 210 points de base en glissement annuel sur une base organique principalement en raison de volumes plus faibles dans Specialty Polymers partiellement compenss par des conomies de cots structurellesLe rsultat net sousjacent attribuable aux actionnaires de Syensqo slve 381 millions deurosCash flow oprationnel de 779 millions Free cash flow de 356 millions soutenu par labsence du paiement de 167 millions deuros au NJDEP par des dpenses dinvestissement infrieures celles de lexercice prcdent et par des entres de trsorerie lies au fonds de roulementRendement accru pour les actionnaires environ 1687000 actions ont t rachetes soit lquivalent denviron 116 millions deuros en 2025 un dividende pour 2025 de 162 taux de distribution de 44 sera propos lAssemble gnrale annuelle 2026 par le Conseil dadministrationCession de lactivit Oil amp Gas finalise en janvier 2026 pour une valeur dentreprise de 135 millions deuros soit environ 7x lEVEBITDA contribuant lavancement de la stratgie de pure player dans la chimie de spcialit Rsultats pro forma incluant les activits abandonnes Pro forma incl Oil amp Gas T4 2025T4 2024T3 2025Var annuelleVar orgVar sqFY 2025FY 2024Var annuelleVar orgChiffre daffaires net1418159815171135665614065636532Marge brute 39748248417618019012219143Marge brute 280302319220 bps390 bps310338280 bpsEBITDA sousjacent23829832620217227212101412143124Marge dEBITDA sousjacent168186215190 bps230 bps480 bps197215180 bps210 bpsCash flow oprationnel252345331270nm77984174Free Cash Flow136159250145nm356223596Conversion en cash LTM767176550 bps10 bps7671550 bpsROCE LTM637965160 bps20 bps6379160 bps 1 Les faits marquants sont tablis sur la base de donnes pro forma incluant Oil amp Gas en cohrence avec les perspectives antrieures Pour les informations rglementes au sens de larticle 11 de lArrt royal du 14 novembre 2007 il est renvoy au rapport financier publi le 26 fvrier 2026 disponible sur le site de Syensqo ladresse suivante website Mike Radossich CEO 2025 a t une anne de gnration de trsorerie rsiliente et de maintien des marges dans un environnement de demande difficile Ces fondamentaux offrent une base solide sur laquelle construire En tant que nouveau CEO ma priorit absolue est de dfinir et de commencer mettre en uvre les actions destines stimuler puis acclrer notre croissance Mon mandat est clair acclrer la cration de valeur Nous agissons avec dtermination en renforant lexcution et la discipline en matire de capital ainsi quen amliorant notre capacit convertir linnovation en croissance Nous investissons pour amliorer encore notre performance oprationnelle et jidentifie de multiples opportunits pour soutenir notre performance long terme Au cours de lanne je prvois de prsenter progressivement des mises jour sur le cadre renouvel et les actions qui soutiendront notre prochaine phase de croissance Perspectives 2026 Pour 2026 nous anticipons que lincertitude macroconomique et celle lie la demande persisteront sur la plupart de nos marchs finaux Dans ce contexte notre priorit sera de mettre en uvre les actions relevant de notre contrle afin dacclrer la croissance des volumes et daccrotre la gnration de trsorerie Notre scnario intgre lhypothse dune poursuite des tendances actuelles de la demande et labsence de reprise plus large au cours de lexercice Dans lensemble nous prvoyons en 2026 une croissance des volumes en bas de fourchette de un chiffre tire par Composite Materials soutenue par une demande robuste de la part de nos clients de laronautique civile ainsi que par la diversit de nos programmes et applications clients Pour Specialty Polymers nous nous attendons une croissance lgrement suprieure des volumes porte par la reprise du march final de lautomobile Cette volution devrait toutefois tre compense par des volumes plus faibles dans llectronique de grand public en raison de ventes rduites et dun mix produit dfavorable chez un client majeur ainsi que par la sortie planifie de certains produits en ligne avec notre stratgie de nonrecours aux fluorosurfactants Ensemble ces deux vents contraires devraient reprsenter un impact denviron 30 M sur lEBITDA sousjacent en glissement annuel Sagissant des semiconducteurs mme si la visibilit demeure limite nous anticipons une reprise progressive des volumes en glissement annuel se traduisant par une croissance plus forte au second semestre Cela restera nanmoins un moteur cl de croissance soutenu par notre position de march nos expositions clients et les tendances structurelles de long terme lies la connectivit avance et la demande associe lIA Pour Novecare nous prvoyons une croissance des volumes en bas de fourchette de un chiffre tire par lAgro et le Home amp Personal Care partiellement compense par une lgre baisse des prix Pour Technology Solutions nous anticipons une croissance des volumes en bas milieu de fourchette de un chiffre dans les solutions minires incluant limpact de la fermeture temporaire dune mine dun client en Indonsie qui devrait constituer un vent contraire en glissement annuel au premier semestre 2026 Nous prvoyons que la marge brute de nos quatre principales activits mondiales Specialty Polymers Composite Materials Novecare et Technology Solutions restera globalement stable par rapport 2025 ce qui illustre la solidit de notre proposition de valeur et de notre positionnement de chimie de spcialits Aprs la finalisation de la cession de lactivit Oil amp Gas dbut janvier nous poursuivons le processus de cession dAroma et prvoyons de fournir une mise jour vers la fin du deuxime trimestre Pour soutenir notre rentabilit nous restons en bonne voie pour mener bien notre programme dconomies de cots qui vise gnrer plus de 200 M dconomies annuelles en rgime de croisire dici fin 2026 Sur lensemble de lexercice nous nous attendons ce que ces conomies compensent limpact de linflation sur les cots fixes et variables Enfin nos perspectives tiennent compte de limpact des mouvements de change par rapport leuro qui devraient reprsenter en 2026 un vent contraire denviron 40 M sur lEBITDA sousjacent en glissement annuel Sur une base annuelle hors contribution de lunit oprationnelle Oil amp Gas rcemment cde nos prvisions sont les suivantes EBITDA2 sousjacent denviron 11 Md contre 1143 Md en 2025Cash flow oprationnel denviron 700 M contre 7794 M en 2025Dpenses dinvestissement5 Capex infrieures 500 M contre 5634 M en 2025 2 Supposant un taux de change EURUS de 120 contre 113 sur lexercice 20253 taux de change et primtre constants4 Y compris les activits abandonnes5 Dont environ 50 millions deuros de dpenses dinvestissement lies la mise en uvre du nouveau progiciel ERP Plus dinformations sur les rsultats de lanne 2025 sont disponibles sur le site web Informations prospectivesCe communiqu peut contenir des informations prospectives Les dclarations prospectives dcrivent les attentes plans stratgies objectifs vnements futurs ou intentions La ralisation des dclarations prospectives contenues dans ce communiqu est sujette des risques et des incertitudes en raison dun certain nombre de facteurs y compris des facteurs conomiques dordre gnral les fluctuations des taux dintrt et des taux de change lvolution des conditions de march la concurrence des produits la nature du dveloppement dun produit limpact des acquisitions et des dsinvestissements des restructurations du retrait de certains produits du processus dapprobation rglementaire des scnarii globaux des projets de RampI et dautres lments inhabituels Par consquent les rsultats rels ou vnements futurs peuvent diffrer sensiblement de ceux exprims ou implicites dans ces dclarations prospectives Si de tels risques connus ou inconnus ou des incertitudes se concrtisent ou si nos hypothses savraient inexactes les rsultats rels pourraient diffrer considrablement de ceux anticips La socit ne sengage nullement mettre jour publiquement ses dclarations prospectives A propos de SyensqoSyensqo est une entreprise fonde sur la science qui dveloppe des solutions novatrices permettant damliorer notre faon de vivre de travailler de voyager et de nous divertir Inspirs par les congrs scientifiques initis par Ernest Solvay en 1911 nous runissons des talents brillants qui repoussent sans cesse les limites de la science et de linnovation au profit de nos clients avec plus de 13 000 employs Nous dveloppons des solutions qui contribuent offrir des produits plus srs plus propres et plus durables que lon retrouve dans lhabitat lalimentation et les biens de consommation les avions les voitures les batteries les appareils lectroniques et les soins de sant Notre force dinnovation nous permet de concrtiser lambition dune conomie circulaire et dexplorer des technologies rvolutionnaires qui feront progresser lhumanit Plus dinformations sur wwwsyensqocom Resultaten Syensqo vierde kwartaal en volledig jaar 2025 Vrije kasstroom in 2025 van 356 miljoen boven eerdere outlook Pro forma onderliggende ebitda voor 2025 van 121 miljard met veerkrachtige marge 4 nettoomzetgroei in Composite Materials ondersteund door een sterk vierde kwartaal Brussel 26 februari 2026 7u00 CET Kw4 2025 hoogtepunten1 Nettoomzet van 142 miljard werd benvloed door jaaropjaar ongunstige wisselkoersen 6 en lagere volumes 5 terwijl de prijszetting stabiel bleef jaaropjaar organische groei van 11 in Composite MaterialsBrutowinst van 397 miljoen daalde met 18 ten opzichte van vorig jaar voornamelijk als gevolg van lagere volumes en ongunstige wisselkoersbewegingen resulterend in een brutomarge van 28Onderliggende EBITDA van 238 miljoen daalde organisch met 17 op jaarbasis voornamelijk door lagere onderliggende EBITDA in Specialty Polymers en Technology Solutions deels gecompenseerd door structurele kostenbesparingen en sterke groei in Composite MaterialsOnderliggende EBITDAmarge van 17 daalde jaaropjaar op organische basis met 230 basispunten voornamelijk door lagere volumes in Specialty Polymers deels gecompenseerd door structurele kostenbesparingenOnderliggende winst toegekend aan Syensqo aandeelhouders van 31 miljoenOperationele kasstroom 252 miljoen vrije kasstroom van 136 miljoen ondersteund door kasinstromen uit werkkapitaal en lagere kapitaalinvesteringen op jaarbasis 2025 hoogtepunten Nettoomzet van 614 miljard werd benvloed door jaaropjaar ongunstige wisselkoersbewegingen 3 en lagere volumes 3 terwijl de prijszetting stabiel bleef jaaropjaar organische groei van 4 in Composite MaterialsBrutowinst van 1901 miljoen daalde jaaropjaar met 14 voornamelijk als gevolg van lagere volumes en ongunstige wisselkoersbewegingen resulterend in een brutomarge van 31Onderliggende EBITDA van 1210 miljoen daalde jaaropjaar organisch met 12 voornamelijk door een lagere onderliggende EBITDA in Specialty Polymers en Novecare deels gecompenseerd door structurele kostenbesparingenOnderliggende EBITDAmarge van 20 daalde jaaropjaar organisch met 210 basispunten voornamelijk door lagere volumes in Specialty Polymers deels gecompenseerd door structurele kostenbesparingenOnderliggende winst toegekend aan Syensqo aandeelhouders van 381 miljoenOperationele kasstroom van 779 miljoen vrije kasstroom van 356 miljoen ondersteund door de afwezigheid van de betaling van 167 miljoen aan de NJDEP lagere jaaropjaar kapitaalinvesteringen en kasinstromen uit werkkapitaalVerhoogde uitkeringen in contanten aan aandeelhouders circa 1687000 ingekochte aandelen of ongeveer 116 miljoen in 2025 Dividend voor 2025 van 162 uitbetalingsratio van 44 zal worden voorgesteld aan de Algemene Vergadering van Aandeelhouders in 2026 door de Raad van BestuurVerkoop van de business unit Oil amp Gas voltooid in januari 2026 voor een ondernemingswaarde van 135 miljoen of ongeveer 7x EVEBITDA waarmee de strategie van de onderneming als pureplay specialtyspeler verder wordt uitgevoerd Pro forma resultaat inclusief beindigde bedrijfsactiviteiten Pro forma incl Oil amp Gas 1Onderliggend in mlnKw4 2025Kw4 2024Kw3 2025JoJ veranderingJoJ organischKwoKw verandering20252024JoJ veranderingJoJ organischNettoomzet1418159815171135665614065636532Brutowinst39748248417618019012219143Brutomarge280302319220 bps390 bps310338280 bpsEBITDA23829832620217227212101412143124EBITDAmarge168186215190 bps230 bps480 bps197215180 bps210 bpsOperationele kasstroom252345331270nm77984174Vrije kasstroom136159250145nm356223596Kasstroomomzetting LTM767176550 bps400 bps7671550 bpsROCE LTM637965160 bps70 bps6379160 bps 1 Hoogtepunten op basis van Pro Forma cijfers inclusief Oil amp Gas consistent met voorgaande outlook Voor gereglementeerde informatie zoals gedefinieerd in Artikel 11 van het Koninklijk Besluit van 14 November 2007 verwijzen we naar het financile verslag gepubliceerd op 26 februari 2026 dat beschikbaar is op Syensqos website Mike Radossich CEO 2025 was een jaar van veerkrachtige kasstroomgeneratie en margeprestaties in een uitdagende vraagomgeving Deze fundamenten vormen een sterk platform om op voort te bouwen Als nieuwe CEO is mijn hoogste prioriteit het definiren en starten van de acties die onze groei zullen stimuleren en uiteindelijk versnellen Mijn mandaat is duidelijk de waardecreatie versnellen We handelen met urgentie we scherpen onze uitvoering en kapitaaldiscipline aan en versterken onze omzetting van innovatie naar groei We investeren in ons vermogen om te presteren en ik zie meerdere kansen om onze langetermijnprestaties te bevorderen In de loop van het jaar ben ik van plan om op geregelde basis updates te geven over het vernieuwde kader en de acties die de volgende groeifase van ons bedrijf zullen ondersteunen Vooruitzichten voor 2026 Voor 2026 verwachten we dat de macroeconomische onzekerheid en de onzekerheid in de vraag zullen aanhouden in de meeste van onze eindmarkten In deze context ligt onze prioriteit bij de uitvoering van acties binnen onze controle om zowel de volumegroei te versnellen als de kasstroom te verhogen In onze vooruitzichten is opgenomen dat de huidige vraagtrends zich zullen voortzetten en dat er gedurende het jaar geen breder marktherstel zal plaatsvinden Over het geheel genomen verwachten we lage enkelcijferige volumegroei in 2026 waarbij Composite Materials de verbetering zal aanvoeren gesteund door een sterke vraag vanuit klanten in de civiele luchtvaart evenals door ons brede scala aan klantenprogrammas en toepassingen Voor Specialty Polymers verwachten we een licht hogere volumegroei gedreven door de groei in de automobielmarkt Dit zal naar verwachting worden gecompenseerd door lagere volumes in Consumer Electronics als gevolg van lagere verkopen en een ongunstige productmix bij een grote klant evenals de geplande afbouw van bepaalde producten in lijn met onze strategie om fluorosurfactanten te bannen Samen zullen deze twee factoren naar verwachting een impact hebben van ongeveer 30 miljoen op de onderliggende EBITDA op jaarbasis Voor semiconductors blijft de zichtbaarheid uitdagend maar we verwachten een geleidelijk herstel in de volumes op jaarbasis wat zal resulteren in een sterkere groei in de tweede helft van het jaar Toch blijft dit een belangrijke groeimotor ondersteund door onze marktpositie klantenportefeuille en de langetermijntrends in geavanceerde connectiviteit en AIgerelateerde vraag Voor Novecare verwachten we lage enkelcijferige volumegroei gedreven door Agro en Home amp Personal Care gedeeltelijk gecompenseerd door iets lagere prijzen Voor Technology Solutions verwachten we een lage tot middelhoge enkelcijferige volumegroei in Mining Solutions inclusief de impact van de tijdelijke sluiting van een mijn in Indonesi wat in de eerste helft van 2026 een tegenwind zal zijn ten opzichte van vorig jaar We verwachten dat de brutomarge binnen onze vier kern business units Specialty Polymers Composite Materials Novecare en Technology Solutions grotendeels stabiel zal blijven ten opzichte van 2025 wat onze sterke waardepropositie en gespecialiseerde positionering weerspiegelt Na de voltooiing van de verkoop van de Oil amp Gasactiviteiten begin januari gaan we verder met de geplande verkoop van Aroma en verwachten we tegen het einde van het tweede kwartaal een update te geven Ter ondersteuning van onze winstgevendheid blijven we op koers om onze kostenbesparingsdoelstelling te realiseren die gericht is op meer dan 200 miljoen aan besparingen op jaarbasis tegen eind 2026 Over het hele jaar verwachten we dat de kostenbesparingen de inflatoire effecten op vaste en variabele kosten zullen compenseren Tot slot omvatten onze vooruitzichten de impact van valutaschommelingen ten opzichte van de euro waarvan we verwachten dat deze in 2026 een negatieve impact van ongeveer 40 miljoen zal hebben op de onderliggende EBITDA ten opzichte van vorig jaar Op jaarbasis exclusief de recent gedesinvesteerde Oil amp Gasactiviteiten zijn onze vooruitzichten als volgt Onderliggende EBITDA2 van ongeveer 11 miljard ten opzichte van 1143 miljard in 2025Operationele kasstroom van ongeveer 700 miljoen ten opzichte van 7794 miljoen in 2025Kapitaalinvesteringen5 van minder dan 500 miljoen ten opzichte van 5634 miljoen in 2025 2 Verondersteld EURUS 12 in vergelijking met 113 in het jaar 20253 Aan constante wisselkoers en omvang4 Beindigde Activiteiten inbegrepen5 Omvat ongeveer 50 miljoen aan kapitaalinvesteringen verbonden aan de implementatie van het nieuwe ERP systeemMeer gedetailleerde informatie over de jaarresultaten beschikbaar op de website Wettelijke bepaling als bescherming tegen onredelijke aansprakelijkheidsstellingen Dit persbericht kan toekomstgerichte informatie bevatten Toekomstgerichte verklaringen beschrijven verwachtingen plannen strategien doelen toekomstige gebeurtenissen of intenties De verwezenlijking van toekomstgerichte verklaringen die in dit persbericht staan is onderworpen aan en is afhankelijk van risicos en onzekerheden verbonden aan verschillende factoren waaronder algemene economische factoren schommelingen van interestvoeten en wisselkoersen veranderende marktcondities concurrentie op producten de aard van de productontwikkeling het effect van verwervingen en verkopen herstructureringen terugtrekkingen van producten goedkeuringen door regelgevers het allin scenario van onderzoeks en innovatieprojecten en andere ongebruikelijke zaken Om deze reden kunnen de actuele of toekomstige resultaten wezenlijk afwijken van de resultaat die expliciet gemeld worden of impliciet besloten zijn in dergelijke toekomstgerichte verklaringen Mochten bekende of onbekende risicos of onzekerheden zich voltrekken of mochten onze aannames onjuist blijken te zijn dan kunnen de daadwerkelijke resultaten sterk afwijken van de verwachte resultaten Syensqo verplicht zich niet om toekomstgerichte verklaringen publiekelijk te actualiseren of te herzien Over SyensqoSyensqo is een wetenschapsbedrijf dat baanbrekende oplossingen ontwikkelt die de manier waarop we leven werken reizen en ons vermaken verbeteren Genspireerd door de wetenschappelijke raden die Ernest Syensqo in 1911 organiseerde brengen we het briljante talent samen dat de grenzen van wetenschap en innovatie verlegt ten voordele van onze klanten met een wereldwijd team van meer dan 13000Onze oplossingen dragen bij aan veiligere schonere en duurzamere producten in huizen voeding en consumptiegoederen vliegtuigen autos batterijen slimme apparaten en toepassingen in de gezondheidszorg Onze innovatiekracht stelt ons in staat om de ambitie van een circulaire economie waar te maken en baanbrekende technologien te ontwikkelen die de mensheid vooruit helpen Meer informatie op wwwsyensqocom Media RelationsmediarelationssyensqocomPerrine Marchal 32 478 32 62 72Laetitia Schreiber 32 487 74 38 07Investor RelationsinvestorrelationssyensqocomSherief Bakr 44 7920 575 989Robbin MooreRandolph 1 470 493 2433Loc Flament 32 478 69 74 20Eva Behaeghe 32 474 49 23 50 Attachments 20260226Syensqo fourth quarter and full year 2025 resultsEN 20260226Syensqo fourth quarter and full year 2025 resultsNL 20260226Syensqo fourth quarter and full year 2025 resultsFR

Century Aluminum Company Statement on U.S. Supreme Court IEEPA Ruling
CHICAGO Feb 20 2026 GLOBE NEWSWIRE Century Aluminum Company NASDAQ CENX today issued the following statement regarding the US Supreme Courts decision on the tariffs imposed under the International Emergency Economic Powers Act IEEPA Century Aluminum proudly stands with President Donald J Trump and his America First trade policies which have been instrumental in ensuring a level playing field for American industry and workers and restoring the US industrial base Those trade policies include the IEEPA tariffs addressed in todays Supreme Court ruling as well as the Section 232 steel and aluminum tariffs which were not impacted by the decision and remain in full force and effect President Trumps trade policies have strengthened our commitment to reshoring American production of primary aluminum a critical metal for industries ranging from aerospace and automobiles to national defense Since the Section 232 program was reinforced by President Trump a year ago with no exemptions and no exceptions Century Aluminum has taken decisive action to expand US aluminum production and create new American manufacturing jobs including Immediately increasing total US primary aluminum production by almost 10 through the expansion of our Mt Holly SC smelter andAnnouncing plans to build the first new American aluminum smelter in close to 50 years with EGA a project that will double US production and create over 1000 permanent jobs and 4000 construction jobs in Inola Oklahoma No company is investing more in US primary aluminum production than Century Century is already the largest producer of aluminum in the United States smelting nearly 60 of the countrys primary aluminum employing more American primary aluminum workers than any other company and thanks to President Trumps leadership and the Section 232 program we plan to invest billions more in new and expanded production at Mt Holly and our Oklahoma smelter project Century is grateful to President Trump for his unwavering commitment to American workers and American industry Century remains committed to investing in America as the largest producer of this critical mineral for decades to come Investors Chad Rigg 3126963132 investorrelationscenturyaluminumcomMedia Tawn Earnest 6146986351 tawnearnestcenturyaluminumcom

ASP Isotopes Announces Establishment of Quantum Leap Energy Strategic Advisory Board, Bolstering its Plans for the Nuclear Fuel Sector
Distinguished Nuclear Fuel and Advanced Materials Leaders Appointed as Initial SAB MembersDALLAS Feb 19 2026 GLOBE NEWSWIRE ASP Isotopes Inc NASDAQ ASPI ASPI today announced that Quantum Leap Energy LLC QLE or the Company a whollyowned subsidiary of ASPI dedicated to advancing innovative technologies and processes across critical segments of the fission and fusion nuclear fuel cycle has formed a Strategic Advisory Board SAB and appointed as initial SAB members two distinguished nuclear fuel and advanced materials industry leaders Mary Lou DunzikGougar and Kevin Kramer The SAB is expected to provide guidance and insights as QLE aims to address gaps in the nuclear fuel cycle promote safe nuclear power and enhance the sustainability of the nuclear fuel cycle for advanced nuclear reactors fusion systems as well as the existing nuclear fleet QLE is developing a suite of proprietary technologies and processes designed to address inefficiencies environmental concerns and supply chain vulnerabilities in the nuclear fuel cycle The Companys approaches seek to emphasize modular scalable designs that incorporate advanced materials automation rapid deployment and digital monitoring to reduce costs and enhance safety The formation of our Strategic Advisory Board represents a significant step forward in QLEs commercial evolution said Ryno Pretorius Chief Executive Officer of QLE Mary Lou and Kevin bring deep technical industry and government expertise that strengthens our ability to execute at scale We believe their leadership will help accelerate our market entry deepen strategic partnerships and position QLE as a meaningful participant in the evolving nuclear fuel landscape Additional Information About the Initial Members of the QLE Strategic Advisory Board Mary Lou DunzikGougar is the associate dean of the Idaho State University ISU College of Science and Engineering a professor of nuclear engineering and a senior reactor operator at ISUs AerojetGeneral Nucleonics nuclear reactor commonly known as the AGN201 Presently she teaches core graduate and undergraduate courses in the nuclear science and engineering programs at ISU and contributes to the development and coordination of the curricula DunzikGougar also performs nuclear materials research and is involved in regional and discipline accreditations ISUs international program development and reactor administration She has published internationally and is recognized as principal investigator of productive research projects incorporating nuclear material irradiation and characterization and the associated management of radioactive material She served as President of the American Nuclear Society ANS for the 20202021 term Kevin Kramer is a business development expert with extensive experience commercializing advanced materials technologies for defense energy and government markets In his CSuite and leadership roles at Allegheny Technologies Incorporated ATI a publicly traded specialty materials manufacturer he developed deep relationships with Department of Defense contractors and suppliers across aerospace defense and energy sectors Previously as President of Growth Initiatives and Transportation Products for Alcoa Inc Kevin managed strategic partnerships with government agencies and navigated federal funding opportunities for advanced materials development His established network within defense contracting government procurement and energy sector partnerships positions him to identify funding opportunities through SBIRSTTR programs Department of Energy initiatives and Defense Innovation Unit collaborations while his proven track record in government relations provides critical capabilities for building sustainable revenue pipelines with institutional customers QLE intends to leverage ASPIs proprietary isotope separation technologies both the Aerodynamic Separation Process ASP process and the laserbased Quantum Enrichment QE process to provide isotopic products critical to the nuclear fuel cycle Compared to both legacy and emerging methods QLE believes its isotope enrichment technology stacks offer distinct advantages including reduced capital expenditure accelerated construction timelines and enhanced flexibility in facility design and siting About Quantum Leap Energy Quantum Leap Energy is a development stage nuclear fuels company dedicated to advancing innovative technologies and processes across critical segments of the nuclear fuel cycle The Company focuses on both frontend activities including uranium conversion enrichment of uranium235 for nuclear fuel production HALEU LEU and LEU and isotopic separation of lithium6 and lithium7 as well as backend radioactive waste treatment technologies Through exclusive global rights to proprietary Aerodynamic Separation Process ASP and laserbased Quantum Enrichment QE technologies Quantum Leap Energy aims to address gaps in the nuclear fuel supply chain for advanced nuclear reactors small modular reactors and fusion systems The Company has established strategic partnerships or commercial initiatives and relationships with industry leaders including TerraPower Fermi America and the South Africa Nuclear Energy Corporation Necsa to accelerate the commercialization of critical isotopes essential for nextgeneration nuclear energy systems For additional information please visit httpswwwqleapenergycom About ASP Isotopes Inc ASP Isotopes Inc is a development stage advanced materials company dedicated to the development of technology and processes to produce isotopes for use in multiple industries ASPI employs proprietary ASP technology ASPIs initial focus is on producing and commercializing highly enriched isotopes for the healthcare and technology industries ASPI also plans to enrich isotopes for the nuclear energy sector using QE technology that ASPI is developing ASPI has isotope enrichment facilities in Pretoria South Africa dedicated to the enrichment of isotopes of elements with a low atomic mass light isotopes ForwardLooking Statements Statements contained herein relating to future plans results performance expectations achievements and the like are considered forwardlooking statements within the meaning of the Private Securities Litigation Reform Act of 1995 These forwardlooking statements include but are not limited to projections about future nuclear fusion power generation technologies and enrichment methods QLEs anticipated growth strategies and anticipated trends in QLEs business the anticipated benefits of QLEs Strategic Advisory Board statements relating to QLEs strategic partnerships or commercial initiatives and relationships with Fermi America TerraPower and NECSA and statements we make regarding expected operating results such as future revenues and prospects from the potential commercialization of isotopes future performance under contracts and our strategies for product development engaging with potential customers market position and financial results These forwardlooking statements involve known and unknown risks uncertainties and other factors many of which may be beyond ASPIs or QLEs control that may cause actual results to differ materially from any future results performance or achievements expressed or implied by any forwardlooking statements All forwardlooking statements speak only as of the date hereof QLE and ASPI undertake no obligation to revise or update any forwardlooking statements except as may be required by applicable law ContactQLEicrinccom

HPQ Receives First Purchase Order for 50 kg of Fumed Silica for Advanced Customer Testing
PilotScale Production Achieves Core Specifications Supporting Proposed Joint VentureMONTREAL Feb 19 2026 GLOBE NEWSWIRE HPQ Silicon Inc HPQ or the Company HPQ or the Company TSXV HPQ OTCQBHPQFF FRAO08 a technology company driving innovation in advanced materials and critical process development announces that its subsidiary HPQ Silica Polvere Inc HSPI 2 has received a first purchase order for 50 kilograms of fumed silica from the strategic industrial partner previously disclosed on February 12 2026 The material was produced by HSPIs technology supplier PyroGenesis Inc utilizing the Fumed Silica Reactor FSR pilot plant The product is currently being prepared for delivery to the customer for advanced qualification testing To fulfill the order the FSR was operated in semicontinuous mode for extended production runs beyond prior test campaigns These longerduration operations generated critical process and engineering data that will support scaleup modeling and commercial design parameters for the proposed 1000 tonneperyear facility contemplated under the previously announced nonbinding memorandum of understanding the MOU This first purchase order marks an important operational milestone said Bernard Tourillon Chairman President and CEO of HPQ Silicon Inc and HPQ Silica Polvere Inc It demonstrates that our pilot plant is transitioning from technical validation toward commercial engagement Equally important the extended production runs are providing the engineering data required to responsibly design and derisk the proposed commercialscale facility Technical Validation Supports Commercial Progression Progress toward final agreements under the MOU remains subject to the successful completion of thirdparty testing and validation of fumed silica produced by the FSR pilot plant HSPI confirms that it has received results from production samples previously manufactured and analyzed by an independent specialty laboratory in the United States 2 The testing evaluated chemical composition and material characteristics relevant to the targeted commercial applications and confirmed that the material meets the fundamental specifications required to advance the project The combination of independent laboratory validation and the recent 50 kg purchase order for advanced customer testing indicates that fumed silica produced using the FSR has achieved defined chemical and compositional benchmarks necessary to support continued commercial development efforts Industry Context Fumed silica is a highvalue industrial material used across cosmetics pharmaceuticals food products paints coatings sealants adhesives and construction materials Its function as a thickening anticaking rheologymodifying and reinforcing agent makes it critical to performance and product consistency in largevolume global markets Conventional production methods typically rely on energyintensive processes and centralized largescale facilities The FSR technology seeks to provide an alternative plasmabased approach using quartz SiO as feedstock with the objective of reducing process complexity and eliminating the need for hazardous chemical intermediates The ability to operate the FSR in extended semicontinuous mode while meeting core material specifications reinforces the engineering viability of this plasmabased approach P Peter Pascali President and CEO of PyroGenesis Inc commented on the development Our objective has always been to demonstrate that fumed silica can be produced in a more energyefficient and modular manner These production runs represent another step in validating that the process can support commercial deployment parameters Next Steps Toward Commercialization The formation of the joint venture contemplated under the MOU remains subject to the negotiation and execution of definitive agreements governing the rights and obligations of the parties The parties currently anticipate completing such agreements by the end of Q2 2026 however there can be no assurance that a joint venture will be formed that definitive agreements will be executed within the anticipated timeframe or that any resulting joint venture will be commercially viable We are advancing methodically added Mr Tourillon Independent validation extended pilot production and customer qualification testing are all required steps before commercial commitments are finalized Our focus remains on aligning technical performance engineering scalability and market demand before moving to definitive agreements REFERENCE SOURCES 1While HSPI remains a wholly owned subsidiary of HPQ Silicon Inc technology supplier PyroGenesis is in the final stages of exercising its option to acquire a 50 interest in HSPI as first announced in May 20242The independent material quality analysis for test 7 were conducted by Covalent Metrology About HSPI the Fumed Silica Reactor FSR As HSPI Technological supplier PyroGenesis is the exclusive supplier of a plasmabased technology that uses quartz SiO2 as a raw material to produce commercialgrade fumed silica in a single and ecofriendly process while eliminating the use of harmful chemicals generated by some conventional methods The FSR requires no additional processes to develop and prepare feedstock and no intermediary toxic chemicalbased processing The FSR can produce fumed silica from quartz at one physical location When compared to some multistep traditional processing methodsthe expected benefits of our fumed silica reactor process can generally be summarized as follows 1Lower capital costs2Lower operating costs3Reduction of CO2 emissions4Reduction in energy footprint5Elimination of purchase and storage requirements for hazardous chemicals6Simplified logisticsshortened production chain due to the single location single system single phase process and the elimination of feedstock ingredient handling storage preparationtransformation and transportation7Safer production environment due to absence of dangerous toxic or explosive chemicals About HPQ Silicon HPQ Silicon Inc is a Quebecbased TSX Venture Exchange industrial issuer TSXVHPQ focused on innovation in advanced materials and critical process development In partnership with its research and development partner Novaciumof which HPQ is a shareholderthe Company is advancing nextgeneration siliconbased anode materials Gen3 for batteries commercializing its ENDURA lithiumion cells and developing breakthrough cleanhydrogen and wastetoenergy technologies for which HPQ holds exclusive North American rights HPQ is also pursuing proprietary technologies to become a lowcost zeroCO producer of fumed silica and highpurity silicon with technical support from PyroGenesis Inc Together these initiatives position HPQ to capture growth opportunities in the energy storage clean hydrogen and advanced materials markets essential to achieving global netzero goals For more information please visit HPQ Silicon web site About PyroGenesis Inc PyroGenesis leverages 35 years of plasma technology leadership to deliver advanced engineering solutions to energy propulsion destruction process heating emissions and materials development challenges across heavy industry and defense Its customers include global leaders in aluminum aerospace steel iron ore utilities environmental services military and government From its Montreal headquarters and local manufacturing facilities PyroGenesis engineers scientists and technicians drive innovation and commercialization of energy transition and ultrahigh temperature technology PyroGenesis operations are ISO 90012015 and AS9100D certified with ISO certification maintained since 1997 PyroGenesis shares trade on the TSX PYR OTCQX PYRGF and Frankfurt 8PY1 stock exchanges wwwpyrogenesiscom Cautionary Note Regarding ForwardLooking Information This press release contains forwardlooking statements regarding HPQ Silicons Fumed Silica Reactor project Such statements reflect managements expectations on future performance pilot plant testing commercialization financing and strategic milestones They involve assumptions about technology market conditions financing permits supply chains and economic factors However risksincluding delays financing challenges regulatory changes competition commodity prices geopolitical factors and market demandmay cause actual results to differ materially Readers are cautioned that forwardlooking information is uncertain and not guarantees of future performance Additional risk factors are detailed in HPQs Annual Information Form on SEDAR A more detailed cautionary note regarding forwardlooking information related to HPQ Fumed Silica is available for download here Further information regarding the Company is available in the SEDAR database wwwsedarplusca and on the Companys website at httpwwwhpqsiliconcom Neither the TSX Venture Exchange nor its Regulation Services Provider as that term is defined in the policies of the TSX Venture Exchange accepts responsibility for the adequacy or accuracy of this release This News Release is available on the companysCEO Verified Discussion Forum a moderated social media platform that enables civilized discussion and QampA between Management and Shareholders Source HPQ Silicon Inc For further information contact Bernard J Tourillon Chairman President and CEO Tel 1 514 8463271Email Infohpqsiliconcom

Reliance, Inc. Reports Fourth Quarter and Full Year 2025 Financial Results
Strongest Q4 growth since 2021 with net sales of 35 billion up 119 and record tons sold up 58 yearoveryear 2025 net sales of 143 billion up 33 yearoveryear Record annual tons sold of 64 million up 62 Repurchased 5941 million of common stock in 2025 reducing outstanding shares by 4 including 2001 million in Q4 Increased quarterly dividend 42 to 125 per share annual 500 PHOENIX Feb 18 2026 GLOBE NEWSWIRE Reliance Inc NYSE RS today reported its financial results for the fourth quarter and full year ended December 31 2025 in millions except tons sold which are in thousands per ton and per share amountsSequentialQuarterTwelve Months EndedDecember 31YearOverYearYearOverYearQ4 2025Q3 2025 Change20252024 ChangeQ4 2024 ChangeIncome Statement DataNet sales3498636512421429431383503331266119Gross profit195471031675410754106600886177Gross profit margin1273283102872971028310NonGAAP gross profit margin12274283092882970928612NonGAAP gross profit marginFIFO12285290052962870928803LIFO expense income3872501137144456LIFO expense income as a of net sales1106050810180209LIFO expense income per diluted share net of tax056035162193008NonGAAP pretax expense adjustments12137192271213Pretax income154824773759692113991501335160NonGAAP pretax income216692514336988411670153154878NonGAAP pretax incomeFIFO2205627642561102110226781604282Pretax income margin4468246882144301NonGAAP pretax income marginFIFO5976177774035108Net income attributable to Reliance11651895385739487521551053106Diluted EPS22235938213981556102193150NonGAAP diluted EPS22403643411426159210422281NonGAAP diluted EPSFIFO229639925815881399135230287Balance Sheet and Cash Flow DataCash provided by operations27612618558314142984194733417Free cash flow220291806123502599924973624440Net debttototal capital2144133144102102Net debttoEBITDA209x09x09x06x06xTotal debttoEBITDA211x11x11x08x08xCapital Allocation DataAcquisitions net28364621Capital expenditures732812328943061109Dividends63562925472497612Share repurchases20016095941109371424Key Business MetricsTons sold1528716155546388160132621444358Tons sold samestore1471515542536151558420531390958Average selling price per ton sold22922271092244230326217056Average selling price per ton sold samestore23172296092267232123219456Percentage of sales orders w valueadded processing4950Please refer to the footnotes at the end of this press release for additional information Fourth Quarter 2025 Financial HighlightsTons sold increased 58 compared to the prior year driving a strong 119 increase in net sales Consistent with seasonal patterns and managements guidance tons sold declined 54 compared to the third quarter of 2025 and average selling price per ton sold increased 09 attributable in part to higher aluminum pricing exceeding managements expectation of relatively flat sequential pricing The Company recorded 1137 million of LIFO expense for the full year of 2025 which resulted in 387 million of LIFO expense for the fourth quarter of 2025 exceeding managements 25 million LIFO expense expectation due mainly to higher than anticipated aluminum cost increases Stronger shipments and pricing drove a 452 million or 282 increase in fourth quarter nonGAAP FIFO pretax income to 2056 million Earnings per diluted share improved 15 yearoveryear NonGAAP earnings per diluted share of 240 included a net unfavorable yearend LIFO and income tax trueup impact of 025 per share compared to managements nonGAAP earnings per diluted share guidance of 265 to 285 Normalizing for these LIFO and tax impacts nonGAAP EPS would have been within managements guidance at 265 Full Year 2025 Financial HighlightsNet sales increased 33 compared to 2024 with tons sold up 62 to an annual record The 2025 increase in the Companys tons sold significantly outperformed the industrywide decline of 10 reported by the Metals Service Center Institute MSCI by more than seven percentage points Gross profit was 411 billion consistent with the prior year NonGAAP FIFO gross profit margin which excludes LIFO adjustments expanded 09 over 2024 to 296 in 2025 NonGAAP LIFO gross profit margin decreased 09 to 288 in 2025 from 297 in 2024 driven by a significant yearoveryear swing in LIFO adjustments from 144 million of LIFO income in 2024 to 114 million of LIFO expense in 2025 Overall 2025 earnings per diluted share declined 102 from 2024 however excluding the impact of significant LIFO adjustments from both periods 2025 nonGAAP earnings per diluted share were 1588 a 135 increase from 1399 in 2024 Management CommentaryIn 2025 we demonstrated strong operational execution and continued market share gains underscoring the strength of our business model amid a complex macroeconomic backdrop and competitive operating environment said Karla Lewis President and Chief Executive Officer of Reliance Our commitment to smart profitable growth drove full year shipments to a record 64 million tons sold representing a significant increase in our domestic market share to about 17 from 15 in 2024 By maintaining our focus on exceptional customer service capturing new market opportunities through our ongoing strategic investments and leveraging operating expenses over higher volumes we delivered solid profitable growth and strengthened our longterm market position We grew our 2025 shipments in products and markets with solid demand and increased gross profit margins offset by transitory margin headwinds in certain other products and end markets Mrs Lewis continued Our 2025 results highlight how Reliances diversified business model and unrivaled scale help offset marketspecific weaknesses and support stable performance through economic cycles Entering 2026 we are operating in a healthy demand and strong pricing environment with increasing customer optimism Reliance has the unique scale capabilities talent and capital to continue growing both our core business of small orders with quick turnaround and our participation in large scale projects including increasing activity in the infrastructure data center energy and defense sectors We are excited by the opportunity to continue our profitable growth journey in 2026 End Market CommentaryReliance delivers a diverse range of metal products and valueadded processing services to a wide variety of end markets generally in small quantities on an asneeded basis Nonresidential construction demand including infrastructure representing Reliances largest end market by tons improved from both the fourth quarter and full year of 2024 The Company expects demand to remain healthy in the first quarter of 2026 supported by continued new construction projects across diverse sectors including data centers energy infrastructure and public infrastructure Demand across the broader manufacturing end market Reliance serves improved compared to both the fourth quarter and full year of 2024 primarily due to growth in the military industrial machinery consumer products construction machinery rail and shipbuilding sectors Reliance anticipates that demand for its products across the broader manufacturing sector will remain healthy in the first quarter of 2026 Demand in aerospace improved compared to the fourth quarter of 2024 and was flat compared to the full year of 2024 Reliance anticipates commercial aerospace demand to remain consistent in the first quarter of 2026 with buildrate increases supporting improvement throughout the year Demand in the defense and space related portions of Reliances aerospace business is expected to remain at strong levels in the first quarter of 2026 Demand for the toll processing services Reliance provides to the automotive market improved compared to the full year of 2024 and was relatively flat in the fourth quarter compared to the 2024 fourth quarter The Company expects demand for automotive toll processing to remain relatively steady at healthy levels in the first quarter of 2026 subject to continuing fluidity surrounding North American trade policy Reliances toll processing operations remain flexible and able to quickly adapt to changes in the automotive market Demand for certain products Reliance sells into the semiconductor market remained under pressure compared to both the fourth quarter and full year of 2024 The Company anticipates excess inventory in the supply chain for its products will continue to impact semiconductor demand in the first quarter of 2026 Financial Position and Cash FlowAs of December 31 2025 Reliances cash and cash equivalents totaled 2166 million with total debt outstanding of 143 billion including 2770 million of outstanding borrowings under the Companys 15 billion revolving credit facility Reliance generated cash flow from operations of 2761 million in the fourth quarter and 8314 million for the full year of 2025 Reliance consistently generates strong cash flow from operations across market cycles enabling disciplined and opportunistic capital deployment For the full year of 2025 118 billion of capital was deployed towards stockholder returns and organic growth activities The Companys stockholder returns included 5941 million of share repurchases and 2547 million of dividends Organic growth activities included 3289 million of capital expenditures Stockholder Return ActivityOn February 13 2026 the Board of Directors declared a quarterly cash dividend of 125 per share of common stock an increase of 42 payable on March 20 2026 to stockholders of record as of March 6 2026 Reliance has paid regular quarterly cash dividends for 66 consecutive years without reduction or suspension and has increased the dividend 33 times since its 1994 IPO to a current annual rate of 500 per common share Reliance repurchased approximately 716 thousand shares of its common stock in the fourth quarter of 2025 at an average price of 27930 per share for a total of 2001 million During 2025 Reliance repurchased approximately 22 million shares of its common stock at an average price of 27605 per share for a total of 5941 millionAs of December 31 2025 7635 million remained available under the Companys share repurchase program that was replenished to 15 billion on October 22 2024 Over the last five years Reliance has repurchased approximately 135 million shares of its common stock at an average price of 23073 per share for a total of 312 billion Business OutlookReliance anticipates continued healthy demand in the first quarter of 2026 across several of the key end markets it serves subject to ongoing domestic and international trade policy uncertainty The Company estimates tons sold in the first quarter of 2026 will be up 5 to 7 compared to the fourth quarter of 2025 in line with normal seasonal patterns and coming off of a record fourth quarter tons sold Reliance expects its average selling price per ton sold for the first quarter of 2026 will be up 3 to 5 compared to the fourth quarter of 2025 on announced mill price increases from healthy demand In addition the Company anticipates a modest improvement in FIFO gross profit margin in the first quarter of 2026 compared to the fourth quarter of 2025 Based on these expectations the Company anticipates nonGAAP earnings per diluted share in the range of 450 to 470 for the first quarter of 2026 reflecting yearoveryear growth of 19 to 25 and inclusive of LIFO expense of 25 million or 036 per diluted share Conference Call DetailsA conference call and simultaneous webcast to discuss Reliances fourth quarter and full year 2025 financial results and business outlook will be held on Thursday February 19 2026 at 1100 am Eastern Time 800 am Pacific Time To listen to the live call by telephone please dial 877 4070792 US and Canada or 201 6898263 International approximately 10 minutes prior to the start time and use conference ID 13757939 The call will also be broadcast live over the Internet hosted on the Investors section of the Companys website at investorreliancecom For those unable to participate during the live broadcast a replay of the call will also be available beginning that same day at 200 pm Eastern Time until 1159 pm Eastern Time on March 5 2026 by dialing 844 5122921 US and Canada or 412 3176671 International and entering the conference ID 13757939 The webcast will remain posted on the Investors section of Reliances website at reliancecom for 90 days About Reliance IncFounded in 1939 Reliance Inc NYSE RS is a leading global diversified metal solutions provider and the largest metals service center company in North America Through a network of approximately 310 locations in 41 states and 10 countries outside of the United States Reliance provides valueadded metals processing services and distributes a fullline of over 100000 metal products to more than 125000 customers in a broad range of industries Reliance focuses on small orders with quick turnaround and valueadded processing services In 2025 Reliances average order size was 3120 approximately 49 of orders included valueadded processing and approximately 40 of orders were delivered within 24 hours Reliances press releases and additional information are available on the Companys website atreliancecom ForwardLooking StatementsThis press release contains certain statements that are or may be deemed to be forwardlooking statements within the meaning of the Private Securities Litigation Reform Act of 1995 Forwardlooking statements may include but are not limited to discussions of Reliances industry and end markets business strategies acquisitions expectations concerning the Companys future growth and profitability ability to generate industry leading returns for its stockholders future demand and metals pricing results of operations margins profitability taxes liquidity cash flows capital expenditures expectations for macroeconomic conditions including inflation and the possibility of an economic recession or slowdown anticipated effects from regulatory changes including taxation tariffs and other trade barriers litigation matters and capital resources In some cases you can identify forwardlooking statements by terminology such as may will should could would expect plan anticipate believe estimate predict potential preliminary range intend and continue the negative of these terms and similar expressions These forwardlooking statements are based on managements estimates projections and assumptions as of todays date that may not prove to be accurate Forwardlooking statements involve known and unknown risks and uncertainties and are not guarantees of future performance Actual outcomes and results may differ materially from what is expressed or forecasted in these forwardlooking statements as a result of various important factors including but not limited to actions taken by Reliance as well as developments beyond its control including but not limited to changes in domestic and worldwide political and economic conditions changes in US and foreign trade policies and programs including tariffs and trade policies and programs specifically affecting metals product markets and pricing slowing economic growth inflation rising unemployment or other macroeconomic factors that could materially impact Reliance its customers and suppliers metals pricing demand for Reliances products and services the possibility that the expected benefits of acquisitions and capital expenditures may not materialize as expected and the impacts of labor constraints and supply chain disruptions Deteriorations in economic conditions including as a result of tariffs or trade barriers economic policies inflation economic recession slowing growth outbreaks of infectious disease or geopolitical conflicts such as in Ukraine and the Middle East could lead to a decline in demand for the Companys products and services and negatively impact its business and may also impact financial markets and corporate credit markets which could adversely impact the Companys access to financing or the terms of any financing The Company cannot at this time predict all of the impacts of domestic and foreign tariffs and trade policies inflation product price fluctuations economic recession outbreaks of infectious disease or geopolitical conflicts and related economic effects but these factors individually or in any combination could have a material adverse effect on the Companys business financial position results of operations and cash flows The statements contained in this press release speak only as of the date hereof and Reliance disclaims any and all obligations to publicly update or revise any forwardlooking statements whether as a result of new information future events or for any other reason except as may be required by law Important risks and uncertainties about Reliances business can be found in Item 1A Risk Factors of the Companys Annual Report on Form 10K for the year ended December 31 2024 and in other documents Reliance files or furnishes with the United States Securities and Exchange Commission CONTACT 213 5762428investorreliancecom or Addo Investor Relations310 8295400 Tables to follow Fourth Quarter 2025 Major Commodity MetricsTons Sold tons in thousands changeAverage Selling Price per Ton Sold changeQ4 2025Q3 2025SequentialQuarter ChangeQ4 2024YearOverYearChangeSequentialQuarter ChangeYearOverYearChangeCarbon steel12529132615511850570182Aluminum771804417581748149Stainless steel69875980677313842Alloy27929761278043581Copper amp brass4956125458926202Sales s in millions changeQ4 2025Q3 2025SequentialQuarter ChangeQ4 2024YearOverYearChangeCarbon steel19223203255416808144Aluminum62456215055342169Stainless steel4671489947473213Alloy1555159626143187Copper amp brass935102689705326Full Year 2025 Major Commodity MetricsTons Sold tons in thousands changeAverage SellingPrice per TonSold change20252024YearOverYearChangeYearOverYearChangeCarbon steel52498492106722Aluminum325431912056Stainless steel297229002580Alloy120212352733Copper amp brass21020334170Sales s in millions change20252024YearOverYearChangeCarbon steel790327575643Aluminum247152294477Stainless steel194942068858Alloy6410637705Copper amp brass37673112210Sales by Product s as a of total salesTwelve Months EndedDecember 31Q4 2025Q3 2025Q4 202420252024Carbon steel structurals1312121211Carbon steel plate1112111212Carbon steel tubing999910Hotrolled steel sheet amp coil89888Carbon steel bar55555Galvanized steel sheet amp coil55555Coldrolled steel sheet amp coil22222Carbon steel5354525353Aluminum bar amp tube55555Heattreated aluminum plate55555Common alloy aluminum sheet amp coil55454Common alloy aluminum plate11111Heattreated aluminum sheet amp coil11111Aluminum1717161716Stainless steel bar amp tube66867Stainless steel sheet amp coil55555Stainless steel plate22222Stainless steel1313151314Alloy bar amp rod44344Alloy tube11Alloy44445Miscellaneous65666Toll processing amp logistics44544Copper amp brass33232Other1312131312Total100100100100100 Includes titanium fabricated parts PVC pipe and scrap RELIANCE INCUNAUDITED CONSOLIDATED STATEMENTS OF INCOMEin millions except number of shares which are reflected in thousands and per share amountsThree Months EndedTwelve Months EndedDecember 31December 312025202420252024Net sales3498631266142943138350Costs and expensesCost of sales exclusive of depreciation and amortization shown below254392240510186897284Warehouse delivery selling general and administrative SGampA709266202806726662Depreciation and amortization69370627822687Impairment99117991173332329848132816126750Operating income166314181012711600Other income expenseInterest expense155100557403Other income net4017122202Income before income taxes15481335969211399Income tax provision37927522762619Net income1169106074168780Less net income attributable to noncontrolling interests04072228Net income attributable to Reliance1165105373948752Earnings per share attributable to Reliance stockholdersBasic22419514071570Diluted22219313981556Shares used in computing earnings per shareBasic52066541045255555746Diluted52375545555287556246Cash dividends declared per common share120110480440 Derived from audited financial statements RELIANCE INCUNAUDITED CONSOLIDATED BALANCE SHEETSin millions except number of shares which are reflected in thousands and par valueDecember 31December 3120252024ASSETSCurrent assetsCash and cash equivalents21663181Accounts receivable less allowance for credit losses of 221 and 2321539913420Inventories2187820268Prepaid expenses and other current assets16561482Income taxes receivable312604Total current assets4141138955Property plant and equipment net2633325449Operating lease rightofuse assets31522752Goodwill2169921618Intangible assets net960110072Cash surrender value of life insurance policies net480460Other longterm assets1057912Total assets103733100218LIABILITIES AND EQUITYCurrent liabilitiesAccounts payable37523619Accrued expenses15001444Accrued compensation and retirement benefits19811952Accrued insurance costs564504Current maturities of longterm debt073997Current maturities of operating lease liabilities677614Total current liabilities848112130Longterm debt142027428Operating lease liabilities25092142Longterm retirement benefits249269Other longterm liabilities741568Deferred income taxes57565375Total liabilities3193827912Commitments and contingenciesEquityPreferred stock 0001 par value 5000 shares authorized none issued or outstandingCommon stock and additional paidin capital 0001 par value and 200000 shares authorizedIssued and outstanding shares51735 and 537150101Retained earnings7257673347Accumulated other comprehensive loss8761152Total Reliance stockholders equity7170172196Noncontrolling interests94110Total equity7179572306Total liabilities and equity103733100218 Derived from audited financial statements RELIANCE INCUNAUDITED CONSOLIDATED STATEMENTS OF CASH FLOWSin millionsTwelve Months EndedDecember 3120252024Operating activitiesNet income74168780Adjustments to reconcile net income to net cash provided by operating activitiesDepreciation and amortization expense27822687Impairment99117Provision for credit losses3022Deferred income tax provision371364Stockbased compensation expense556568Other127101Changes in operating assets and liabilities excluding effect of businesses acquiredAccounts receivable19541674Inventories15481168Prepaid expenses and other assets758272Accounts payable and other liabilities691455Net cash provided by operating activities831414298Investing activitiesAcquisitions net of cash acquired283646Purchases of property plant and equipment32894306Proceeds from sales of property plant and equipment17247Other73132Net cash used in investing activities32188037Financing activitiesProceeds from longterm debt borrowings270106630Principal payments on longterm debt242436633Cash dividends and dividend equivalents25472497Share repurchases594110937Taxes paid related to net share settlement of restricted stock units179428Excise tax on repurchase of common shares100Other202101Net cash used in financing activities620213764Effect of exchange rate changes on cash and cash equivalents91118Decrease in cash and cash equivalents10157621Cash and cash equivalents beginning balance318110802Cash and cash equivalents ending balance21663181Supplemental cash flow informationInterest paid547378Income taxes paid net16372449 Derived from audited financial statements RELIANCE INCNONGAAP RECONCILIATIONin millions except per share amountsNet IncomeDiluted EPSThree Months EndedThree Months EndedDecember 31September 30December 31December 31September 30December 31202520252024202520252024Net income attributable to Reliance116518951053222359193Impairment and restructuring charges14712223028002041Nonrecurring settlement credits charges net192210004004002Debt restructuring charge03001Gains related to sales of noncore assets07001Income tax benefit related to above items310954005002010NonGAAP net income attributable to Reliance125519231212240364222LIFO expense net of tax29018842056035008NonGAAP net income attributable to Reliance FIFO154521111254296399230Net IncomeDiluted EPSTwelve Months EndedTwelve Months EndedDecember 31December 31December 31December 312025202420252024Net income attributable to Reliance7394875213981556Impairment and restructuring charges284251054044Nonrecurring income of acquisitions36006Nonrecurring settlement charges net0341001007Debt restructuring charges0315001003Gains related to sales of noncore assets98019Income tax benefit related to above items4868009012NonGAAP net income attributable to Reliance7538895514261592LIFO expense income net of tax8531083162193NonGAAP net income attributable to Reliance FIFO8391787215881399Three Months EndedTwelve Months EndedDecember 31September 30December 31December 31December 3120252025202420252024Pretax income154824771335969211399Impairment and restructuring charges14712223284251Nonrecurring income of acquisitions36Nonrecurring settlement credits charges net1922100341Debt restructuring charges030315Gains related to sales of noncore assets0798NonGAAP pretax expense adjustments12137213192271NonGAAP pretax income166925141548988411670LIFO expense income3872505611371444NonGAAP pretax income FIFO2056276416041102110226Three Months EndedTwelve Months EndedDecember 31September 30December 31December 31December 3120252025202420252024Gross profit LIFO95471031688614107541066Amortization of inventory stepdown36Restructuring charges300885119102NonGAAP gross profit95771032489464119441132LIFO expense income3872505611371444NonGAAP gross profit FIFO99641057490024233139688Gross profit margin LIFO273283283287297Amortization of inventory stepdown as a of salesRestructuring charges as a of sales010301NonGAAP gross profit margin274283286288297LIFO expense income as a of sales1106020810NonGAAP gross profit margin FIFO285290288296287Certain percentages may not calculate due to rounding December 31September 30December 31202520252024Total debt142771389111511Less unamortized debt discount and debt issuance costs687386Carrying amount of debt142091381811425Less cash and cash equivalents216626123181Net debt12043112068244Total Reliance stockholders equity717017305372196Total capital837448425980440Net debttototal capital144133102Twelve Months EndedDecember 31September 30December 31202520252024Net income741673078780Depreciation and amortization278227952687Impairment99117117Interest expense557502403Income taxes227621722619EBITDA131301289314606Net debttoEBITDA09x09x06xTotal debttoEBITDA11x11x08xThree Months EndedTwelve Months EndedDecember 31September 30December 31December 31December 3120252025202420252024Cash provided by operations276126184733831414298Less capital expenditures732812110932894306Free cash flow20291806362450259992 Reliance Incs presentation of nonGAAP and nonGAAPFIFO pretax income net income and EPS over certain time periods is an attempt to provide meaningful comparisons to the Companys historical performance for its existing and future stockholders Adjustments include impairment and restructuring charges related to the closure or reorganization of some of its locations nonrecurring settlement charges and credits nonrecurring expenses related to a term loan agreement and credit agreement amendment gains related to sales of noncore PPampE and nonrecurring income of acquisitions which make comparisons of the Companys operating results between periods difficult using GAAP measures Reliance Incs presentation of gross profit margin FIFO which is calculated as gross profit plus LIFO expense or minus LIFO income divided by net sales is presented to provide a means of comparison amongst its competitors who may not use the same inventory valuation method Please see footnote 1 below for additional information on the Companys gross profit and gross profit margin Reliance Inc presents net debt and total debttoEBITDA as a measurement of leverage utilized by management to monitor its debt levels in relation to its operating cash flow for which it utilizes EBITDA as a proxy Reliance Inc presents free cash flow as a measure of cash generated by its operations that will be used to repay scheduled debt maturities and can be used to invest in growth activities or returned to stockholdersFootnotes1 Gross profit calculated as net sales less cost of sales and gross profit margin calculated as gross profit divided by net sales are nonGAAP financial measures as they exclude depreciation and amortization expense associated with the corresponding sales About half of Reliances orders are basic distribution with no processing services performed For the remainder of its sales orders Reliance performs firststage processing which is generally not labor intensive as it is simply cutting the metal to size Because of this the amount of related labor and overhead including depreciation and amortization is not significant and is excluded from cost of sales Therefore Reliances cost of sales is substantially comprised of the cost of the material it sells Reliance uses gross profit and gross profit margin as shown as measures of operating performance Gross profit and gross profit margin are important operating and financial measures as their fluctuations can have a significant impact on Reliances earnings Gross profit and gross profit margin as presented are not necessarily comparable with similarly titled measures for other companies2 See accompanying NonGAAP Reconciliation
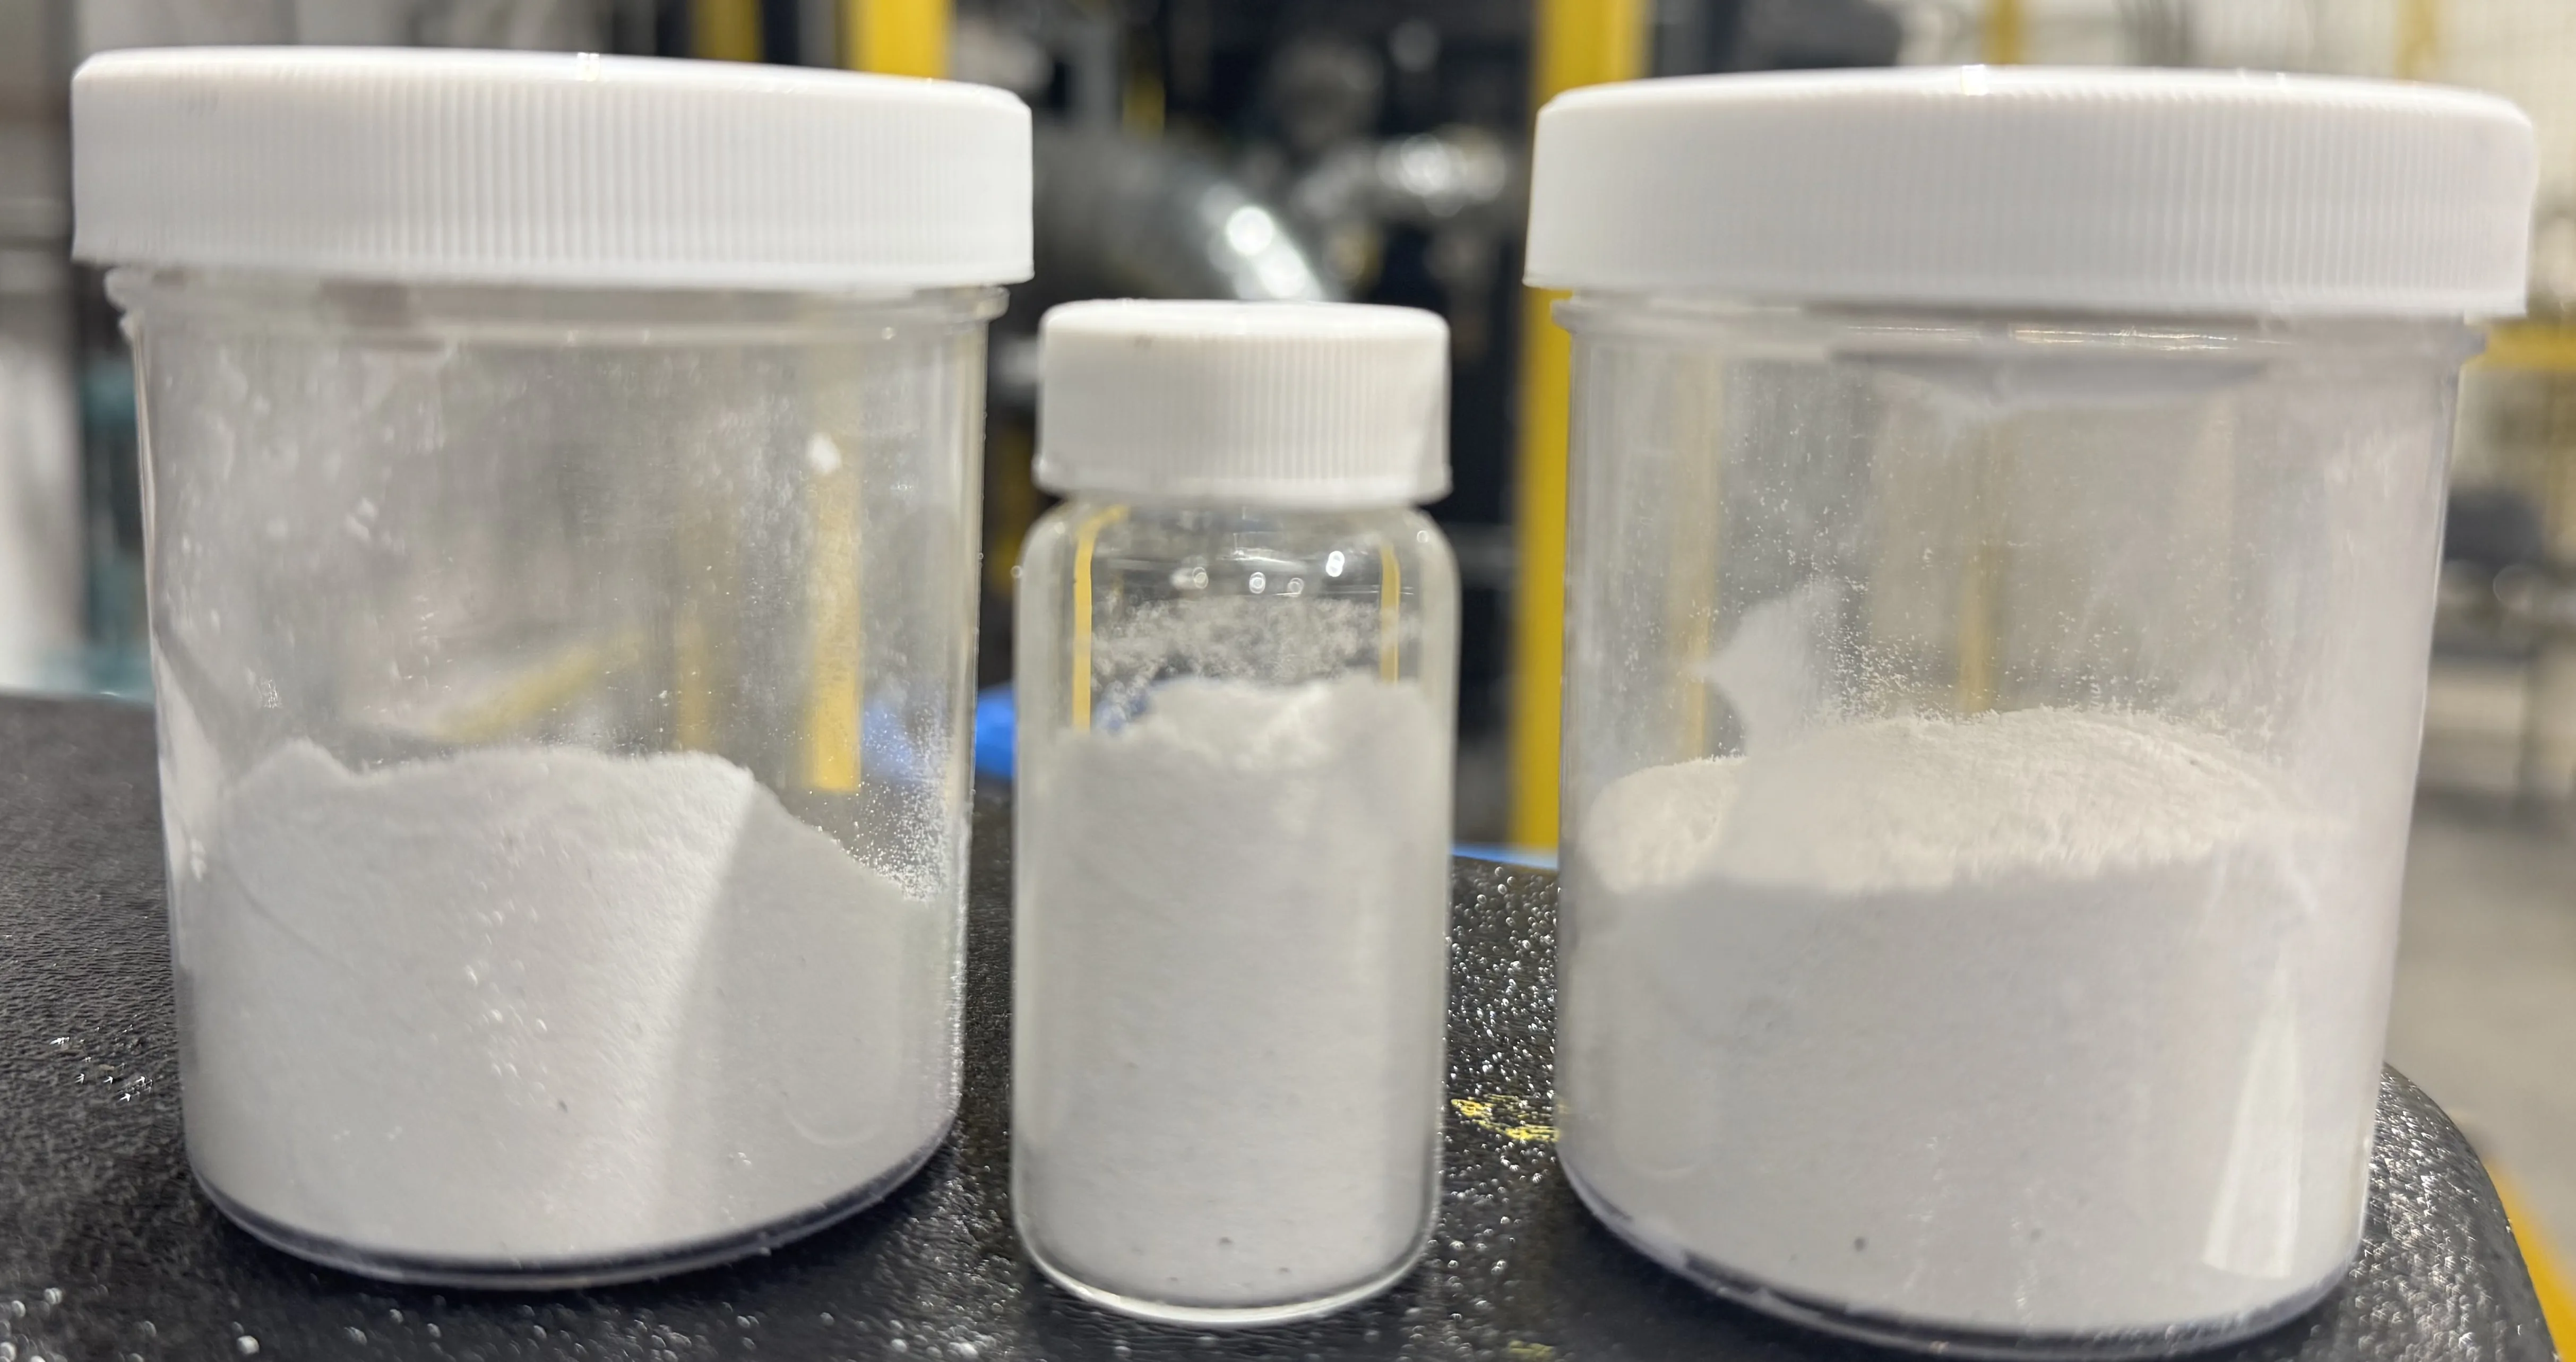
HPQ Signs Joint Venture MOU for a Commercial Fumed Silica Plant with Strategic Partner
The MOU outlines a partnership and a path toward a commercial 1000 Tonne Per Year fumed silica plantMONTREAL Feb 12 2026 GLOBE NEWSWIRE HPQ Silicon Inc HPQ or the Company HPQ or the Company TSXV HPQ OTCQBHPQFF FRAO08 a technology company driving innovation in advanced materials and critical process development announced that its wholly owned subsidiary HPQ Silica Polvere Inc HSPI 1 has signed a nonbinding memorandum of understanding the MOU with a strategic industrial partner to advance the construction and operation of a commercialscale fumed silica production plant The proposed project anticipates the formation of a jointly owned operating company that would build and operate a 1000tonneperyear commercial fumed silica facility with an estimated total project value of US200 million approximately C273 million The plant would be designed and built by PyroGenesis Inc using HSPI proprietary plasmabased Fumed Silica Reactor FSR technology The strategic partner whose identity is being withheld for confidentiality and competitive reasons has already secured project financing and would fund the construction of the facility The project and joint venture under consideration are supported by secured financing and an industrial partner with defined market requirements While this remains subject to technical validation and final agreements it reflects tangible market interest in deploying our technology at scale said Bernard Tourillon President and CEO of HPQ Silicon and HPQ Silica Polvere Inc Image fumed silica produced by the fumed silica reactor Commercial Structure and Strategic Intent The joint venture is expected to own and operate the facility with production sold under an offtake arrangement to the strategic partner terms and conditions yet to be agreed upon Under the contemplated structure HSPI would receive recurring royalties on each kilogram of fumed silica sold pricekg not yet agreed upon providing HSPI and HPQ with longterm exposure to operating revenues while maintaining a capitalefficient profile This structure is intended to align HSPI and HPQs interests with longterm production performance while creating a platform that can be replicated across multiple sites as demand grows Management views this approach as a scalable pathway to commercial deployment rather than a single standalone facility Technical Validation and Path to Definitive Agreements Progress toward final agreements remains contingent on the completion of ongoing thirdparty testing and validation of fumed silica produced by HSPIs existing FSR pilot plant Production samples have already been delivered to both the strategic partner and an independent specialty testing laboratory in the United States These tests are focused on confirming chemical and compositional characteristics required for targeted commercial applications Subject to successful validation the parties expect to complete the negotiation and execution of definitive joint venture and related agreements by the end of the second quarter of 2026 While the MOU reflects a shared intent to proceed there can be no assurance that a joint venture will ultimately be formed that it will be completed within the anticipated timeline or that it will prove commercially viable The FSR converts quartz directly into fumed silica in a singlestep chemicalfree process eliminating the use of hazardous reagents and avoiding the generation of toxic byproducts If the joint venture is finalized delivery and commissioning of the plant are expected within approximately twelve months Management believes that successful commissioning would support the deployment of additional plants of similar or larger capacity positioning the technology as a repeatable industrial solution rather than a oneoff installation Our objective is not simply to build one plant but to establish a commercial model that can be reproduced Tourillon added This initial project for the joint venture will demonstrate that our fumed silica process can operate reliably at industrial scale generate recurring revenues and support future expansion without requiring HPQ to carry the full capital burden If successful it would represent a foundational step toward longterm value creation in advanced materials Industry and Market Context Fumed silica is a critical industrial material used across a wide range of applications including cosmetics pharmaceuticals food products paints coatings sealants construction materials Its role as a thickening anticaking and reinforcing agent makes it essential to product performance consistency and manufacturability in highvolume industrial markets REFERENCE SOURCES 1While HSPI remains a wholly owned subsidiary of HPQ Silicon Inc technology supplier PyroGenesis is in the final stages of exercising its option to acquire a 50 interest in HSPI as first announced in May 2024 About HSPI the Fumed Silica Reactor FSR As HSPI Technological supplier PyroGenesis is the exclusive supplier of a plasmabased technology that uses quartz SiO2 as a raw material to produce commercialgrade fumed silica in a single and ecofriendly process while eliminating the use of harmful chemicals generated by some conventional methods The FSR requires no additional processes to develop and prepare feedstock and no intermediary toxic chemicalbased processing The FSR can produce fumed silica from quartz at one physical location When compared to some multistep traditional processing methodsthe expected benefits of our fumed silica reactor process can generally be summarized as follows 1Lower capital costs2Lower operating costs3Reduction of CO2 emissions4Reduction in energy footprint5Elimination of purchase and storage requirements for hazardous chemicals6Simplified logisticsshortened production chain due to the single location single systemsingle phase process and the elimination of feedstock ingredient handling storagepreparationtransformation and transportation7Safer production environment due to absence of dangerous toxic or explosive chemicals About HPQ Silicon HPQ Silicon Inc is a Quebecbased TSX Venture Exchange industrial issuer TSXVHPQ focused on innovation in advanced materials and critical process development In partnership with its research and development partner Novaciumof which HPQ is a shareholderthe Company is advancing nextgeneration siliconbased anode materials Gen3 for batteries commercializing its ENDURA lithiumion cells and developing breakthrough cleanhydrogen and wastetoenergy technologies for which HPQ holds exclusive North American rights HPQ is also pursuing proprietary technologies to become a lowcost zeroCO producer of fumed silica and highpurity silicon with technical support from PyroGenesis Inc Together these initiatives position HPQ to capture growth opportunities in the energy storage clean hydrogen and advanced materials markets essential to achieving global netzero goals For more information please visit HPQ Silicon web site About PyroGenesis Inc PyroGenesis leverages 35 years of plasma technology leadership to deliver advanced engineering solutions to energy propulsion destruction process heating emissions and materials development challenges across heavy industry and defense Its customers include global leaders in aluminum aerospace steel iron ore utilities environmental services military and government From its Montreal headquarters and local manufacturing facilities PyroGenesis engineers scientists and technicians drive innovation and commercialization of energy transition and ultrahigh temperature technology PyroGenesis operations are ISO 90012015 and AS9100D certified with ISO certification maintained since 1997 PyroGenesis shares trade on the TSX PYR OTCQX PYRGF and Frankfurt 8PY1 stock exchanges wwwpyrogenesiscom Cautionary Note Regarding ForwardLooking Information This press release contains forwardlooking statements regarding HPQ Silicons Fumed Silica Reactor project Such statements reflect managements expectations on future performance pilot plant testing commercialization financing and strategic milestones They involve assumptions about technology market conditions financing permits supply chains and economic factors However risksincluding delays financing challenges regulatory changes competition commodity prices geopolitical factors and market demandmay cause actual results to differ materially Readers are cautioned that forwardlooking information is uncertain and not guarantees of future performance Additional risk factors are detailed in HPQs Annual Information Form on SEDAR A more detailed cautionary note regarding forwardlooking information related to HPQ Fumed Silica is available for download here Further information regarding the Company is available in the SEDAR database wwwsedarplusca and on the Companys website at httpwwwhpqsiliconcom Neither the TSX Venture Exchange nor its Regulation Services Provider as that term is defined in the policies of the TSX Venture Exchange accepts responsibility for the adequacy or accuracy of this release This News Release is available on the companysCEO Verified Discussion Forum a moderated social media platform that enables civilized discussion and QampA between Management and Shareholders Source HPQ Silicon Inc For further information contact Bernard J Tourillon Chairman President and CEOTel 1 514 8463271Email Infohpqsiliconcom A photo accompanying this announcement is available at httpswwwglobenewswirecomNewsRoomAttachmentNgb9c289b62986432b92b37703c5b26e88
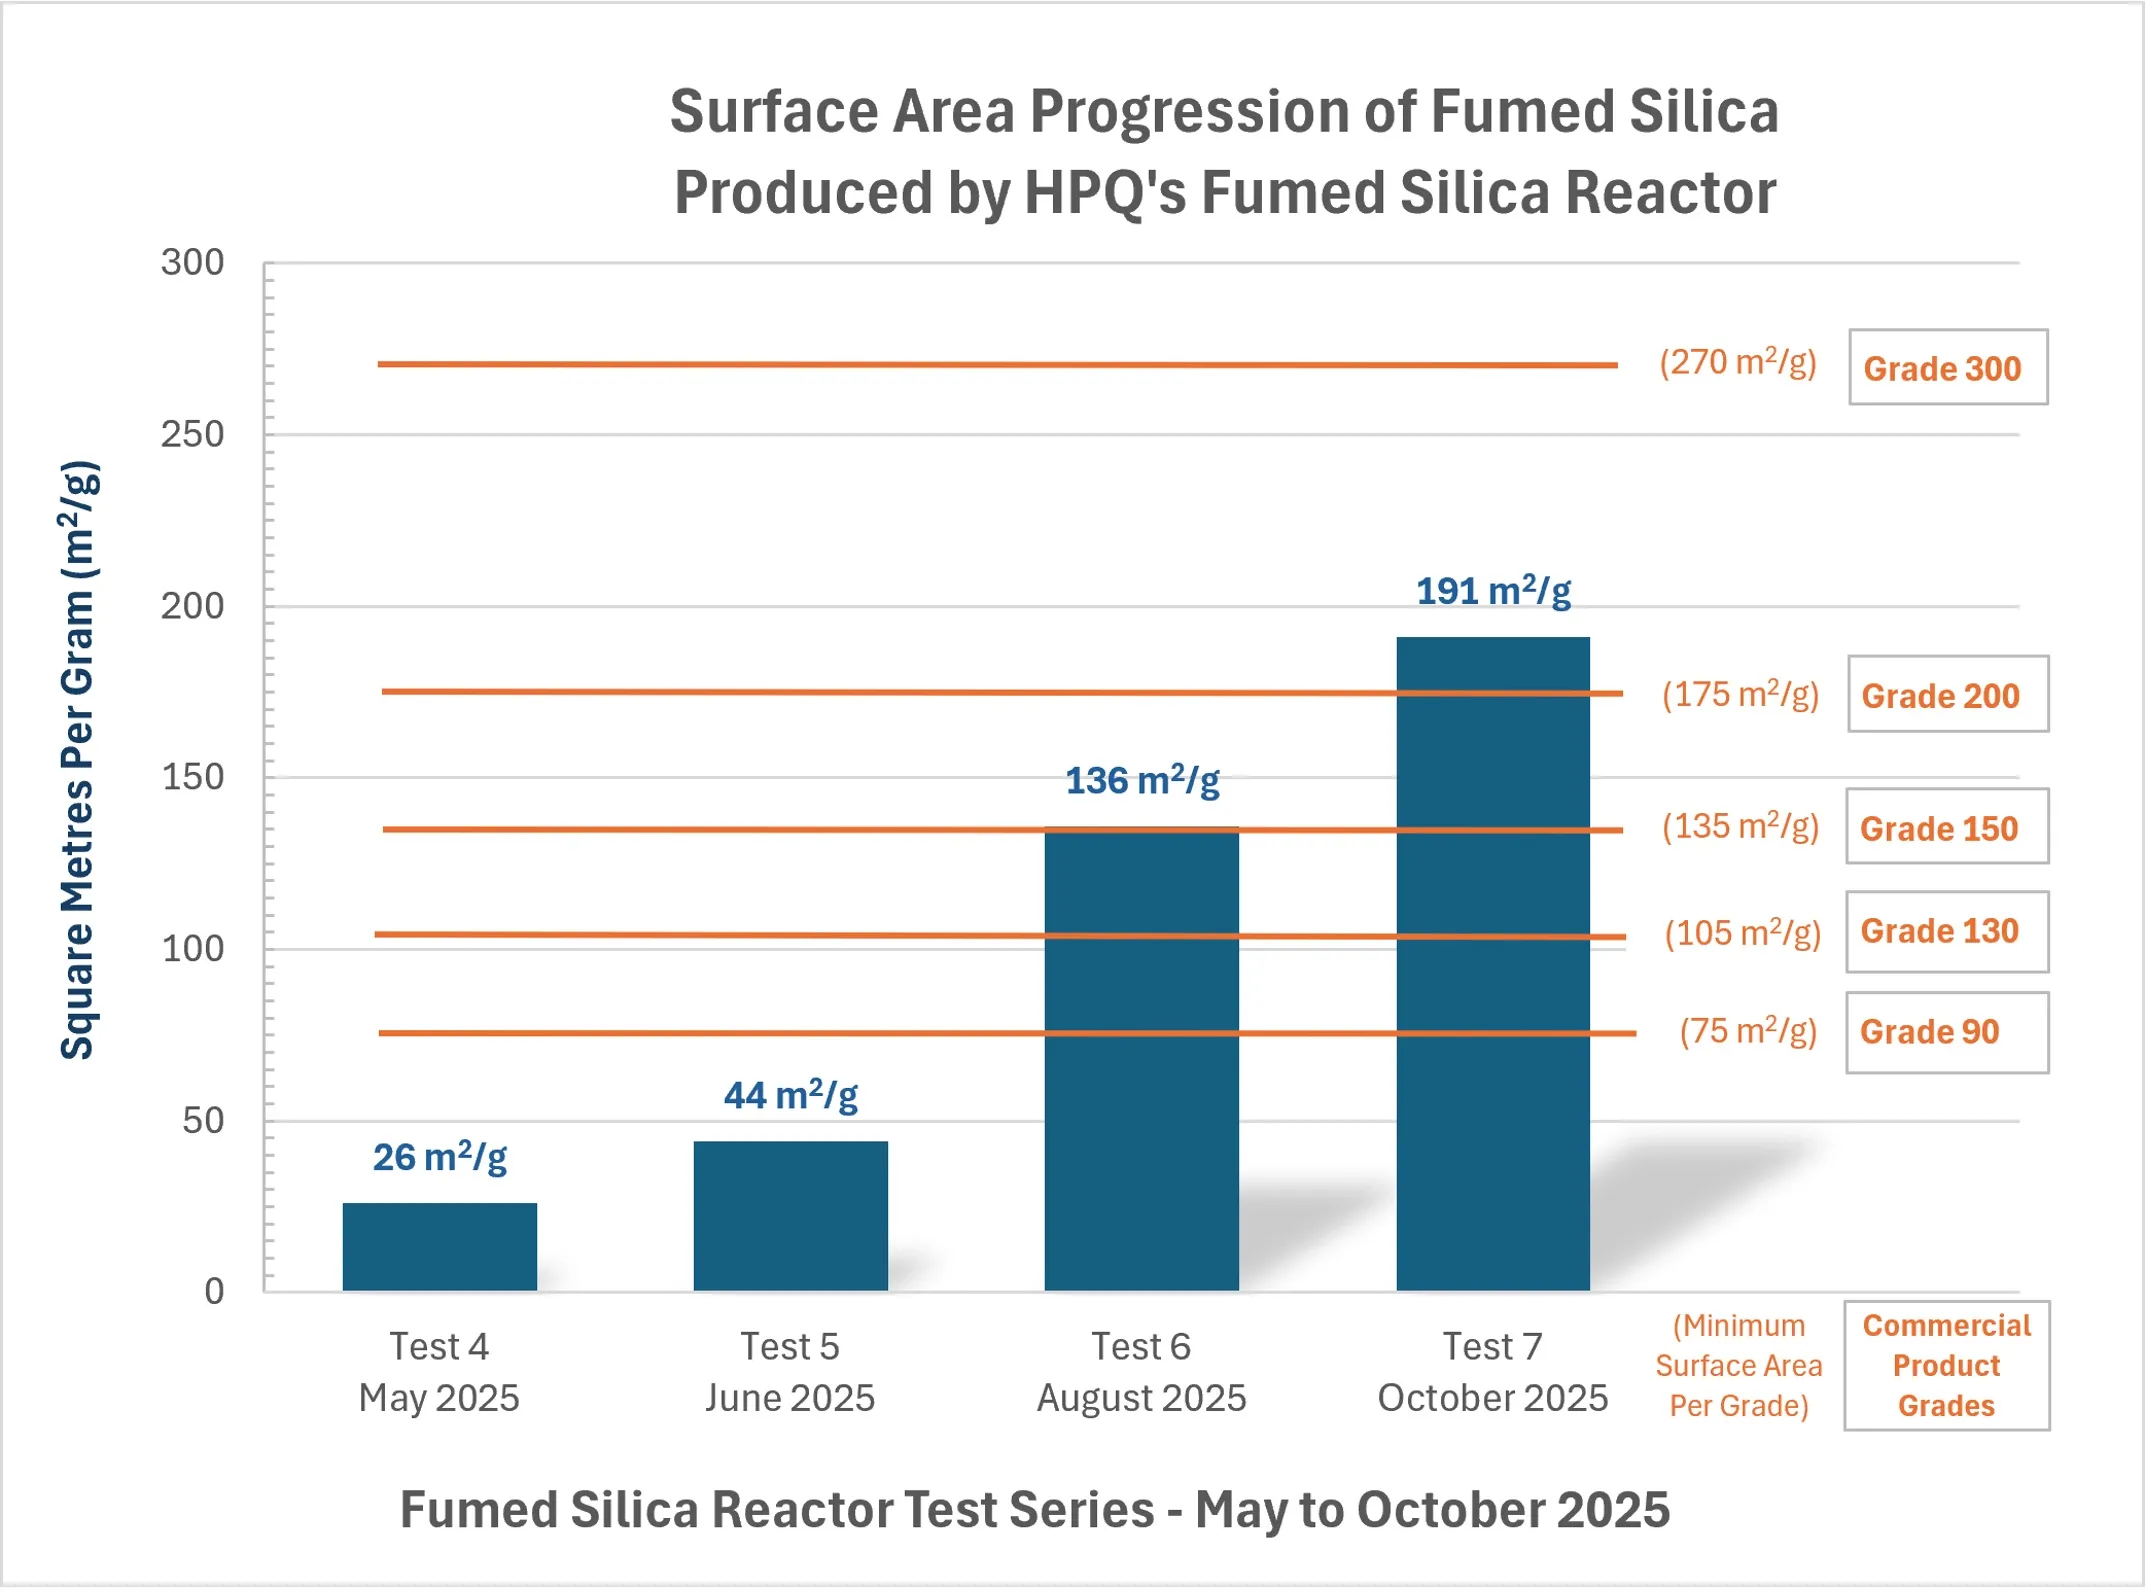
HPQ Confirms Fumed Silica Produced With Pilot Scale Reactor is Independently Verified as Meeting Commercial Grade “150”
New commercial milestone reached lab scale results fully replicatedMONTREAL Jan 30 2026 GLOBE NEWSWIRE HPQ Silicon Inc HPQ or the Company HPQ or the Company TSXV HPQ OTCQBHPQFF FRAO08 a technology company driving innovation in advanced materials and critical process development is pleased to announce that it has recently received independent verification of its most recent test results from a potential customer under LOI 1 These results confirmed that the fumed silica produced by HPQs fumed silica reactor FSR meets or exceeds commercial product grade 150 Specifically the potential customer has confirmed that the material produced during the previously announced Test 7 meets established commercial benchmarks for fumed silica with a specific surface area under BET analysis of approximately 150 mg while at the same time also achieving the required viscosity for that commercial grade With this confirmation the pilot plant has now fully replicated the results produced by HPQ Silica Polvere Incs HSPI 2 original labscale tests These tests which were verified by McGill University were the first results which indicated the possibility of producing commercial grade fumed silica from quartz using a plasmabased system In the companys opinion todays announcement further validates the potential commercial performance of HSPIs proprietary plasmabased process for producing hydrophilic fumed silica directly from quartz without the use of chemicals while creating no hazardous byproducts The Importance of Reaching the Viscosity Milestone In commercial applications such as coatings adhesives and sealants inks elastomers and insulation binders viscosity often referred to as rheology efficiency is a critical performance metric for fumed silica because it governs thickening suspension stability and application behavior For many applications viscosity performance at a given surface area can ultimately determine functionality in enduse formulations Results show that the viscosity achieved by the FSR at pilot scale is approximately 10 higher than that of a typical commercial grade 150 benchmark This result is technically significant because viscosity reflects the combined influence of surface area aggregate structure and surface chemistry under formulation conditions Exceeding grade 150 performance by a doubledigit percentage indicates a welldeveloped threedimensional network and strong thickening efficiency two aspects that are key to stability in highperformance formulations Along with the surface area results surpassing commercial product grade 150 minimums see Graph 1 below the viscosity results that have now been verified provide a meaningful indication that the FSR can reproduce at scale the laboratorylevel benchmark performance announced in November 2023 The viscosity thresholds reached now also indicate that material produced at the pilot plant can be suitable for the type of industrial applications listed above which expands the potential target market for FSRproduced fumed silica into these areas Graph 1 surface area progression of fumed silica produced by HPQs fumed silica reactor Background From Lab to Pilot Scale and Toward Commercial Deployment HSPI and its technology partner PyroGenesis Inc TSXPYR OTCQX PYRGF FRA 8PY1 with support from both the Federal and Provincial governments have designed constructed and commissioned a pilot facility now approaching continuous production runs From the start our overarching goal was clear to produce fumed silica from quartz in a single step using an allelectric plasma process The FSR pilot plant now definitively produces material comparable to or exceeding established commercial benchmarks for fumed silica but with the additional benefits of i a lower carbon footprint and ii without the need for hazardous chemicals Achieving the commercial grade 150 level for fumed silica at our pilot plant which required replicating both specific surface area and viscosity results from our original laboratoryscale testing represents an important milestone for HPQ Silica Polvere Incs fumed silica reactor technology and for HPQ said Bernard Tourillon President and CEO of HPQ Silicon Inc and HPQ Silica Polvere Inc We have successfully scaled laboratory performance by approximately twentyfold while maintaining and in some cases improving key quality metrics Both the independent testing results and a potential client now confirm that our FSR technology can produce fumed silica at performance comparable to established industrial benchmarks by using a more sustainable more efficient and more affordable process Next Steps Continue Process Improvements and Larger Production Runs Building on the progress achieved to date HPQ and PyroGenesis are advancing toward the next phase of process optimization which now will focus on maintaining consistent production with a surface area of approximately 200 mg representing a commercial product grade level of 200 In parallel the parties are preparing for continuous operation of the pilot plant to increase the availability of material and larger batches for evaluation by interested parties under nondisclosure agreements These efforts will support engagement with potential partners in the coatings polymers and advanced materials sectors where highsurfacearea hydrophilic fumed silica is widely used for thickening dispersion and reinforcement applications The latest results support advancing our discussions with a party under a letter of intent while also enabling deeper engagement with industrial players in general noted Tourillon Based on the results achieved to date and the level of market interest we have initiated planning activities toward a potential dedicated production site These developments mark an important step in progressing the fumed silica reactor program toward commercialization End Goal The global fumedsilica market is projected to surpass US257 billion by 2034 3 driven by growing demand in the coatings sealants automotive and lithiumion battery sectors By combining cost advantages with a dramatic reduction in environmental impact HSPI FSR technology positions HPQ as a potential new entrant capable of capturing meaningful market share in a sector long dominated by chemical giants REFERENCE SOURCES 1The viscosity rheology efficiency for test 7 material were conducted by a Leading global fumed silica manufacturer LGFSM under LOI Please see July 9th2024 release2A wholly owned subsidiary of HPQ Silicon Inc when technology supplier PyroGenesis announced its intention to exercise its option to acquire a 50 stake in HSPI in May 20243EXACTITUDE CONSULTANCYFumed Silica Market Overview 20252034 Report About HPQ Silicon HPQ Silicon Inc is a Quebecbased TSX Venture Exchange industrial issuer TSXVHPQ focused on innovation in advanced materials and critical process development In partnership with its research and development partner Novaciumof which HPQ is a shareholderthe Company is advancing nextgeneration siliconbased anode materials Gen3 for batteries commercializing its ENDURA lithiumion cells and developing breakthrough cleanhydrogen and wastetoenergy technologies for which HPQ holds exclusive North American rights HPQ is also pursuing proprietary technologies to become a lowcost zeroCO producer of fumed silica and highpurity silicon with technical support from PyroGenesis Inc Together these initiatives position HPQ to capture growth opportunities in the energy storage clean hydrogen and advanced materials markets essential to achieving global netzero goals For more information please visit HPQ Silicon web site About PyroGenesis Inc PyroGenesis leverages 30 years of plasma technology leadership to deliver advanced engineering solutions to energy propulsion destruction process heating emissions and materials development challenges across heavy industry and defense Its customers include global leaders in aluminum aerospace steel iron ore utilities environmental services military and government From its Montreal headquarters and local manufacturing facilities PyroGenesis engineers scientists and technicians drive innovation and commercialization of energy transition and ultrahigh temperature technology PyroGenesis operations are ISO 90012015 and AS9100D certified with ISO certification maintained since 1997 PyroGenesis shares trade on the TSX PYR OTCQX PYRGF and Frankfurt 8PY1 stock exchanges Cautionary Note Regarding ForwardLooking Information This press release contains forwardlooking statements regarding HPQ Silicons Fumed Silica Reactor project Such statements reflect managements expectations on future performance pilot plant testing commercialization financing and strategic milestones They involve assumptions about technology market conditions financing permits supply chains and economic factors However risksincluding delays financing challenges regulatory changes competition commodity prices geopolitical factors and market demandmay cause actual results to differ materially Readers are cautioned that forwardlooking information is uncertain and not guarantees of future performance Additional risk factors are detailed in HPQs Annual Information Form on SEDAR A more detailed cautionary note regarding forwardlooking information related to HPQ Fumed Silica is available for download here Further information regarding the Company is available in the SEDAR database wwwsedarplusca and on the Companys website at httpwwwhpqsiliconcom Neither the TSX Venture Exchange nor its Regulation Services Provider as that term is defined in the policies of the TSX Venture Exchange accepts responsibility for the adequacy or accuracy of this release This News Release is available on the companysCEO Verified Discussion Forum a moderated social media platform that enables civilized discussion and QampA between Management and Shareholders Source HPQ Silicon Inc For further information contact Bernard J Tourillon Chairman President and CEO Tel 1 514 8463271Email Infohpqsiliconcom A photo accompanying this announcement is available at httpswwwglobenewswirecomNewsRoomAttachmentNg2b9f07e6f1b446948e985a0179277176

Carpenter Technology Reports Second Quarter Fiscal Year 2026 Results
Delivered RecordQuarterly Operating IncomeExpanded Operating Margins in Specialty Alloys Operations SegmentExceeded Second Quarter Operating Income Guidance for Specialty Alloys Operations SegmentDemand Accelerating in Aerospace and Defense EndUse Market with Higher Sequential BookingsCompleted Negotiations for Several Aerospace LongTerm Agreements with Significant Value Realization Increased Operating Income Guidance for Fiscal Year 2026 PHILADELPHIA Jan 29 2026 GLOBE NEWSWIRE Carpenter Technology Corporation NYSE CRS the Company today announced financial results for the fiscal second quarter ended December 31 2025 For the quarter the Company reported operating income of 1552 million and earnings per diluted share of 209 Excluding the special item discussed below adjusted earnings per diluted share was 233 for the current quarter Second Quarter Fiscal Year 2026 Highlights Delivered 1552 million of operating income up 31 percent yearoveryear and a record second quarter resultRealized adjusted earnings per diluted share of 233 in the quarterGenerated 1322 million of cash from operating activitiesExceeded expectations in Specialty Alloys Operations SAO segment with operating income of 1746 million up 29 percent yearoveryearDelivered adjusted operating margin of 331 percent in the SAO segment up from 320 percent sequentially and 283 percent yearoveryear sixteenth consecutive quarterly margin increaseBookings for Commercial Aerospace up 23 percent sequentiallyCompleted negotiations on several longterm agreements with aerospace customers with significant value realization Executed 321 million in share repurchases against 4000 million repurchase program Outlook Increasing operating income guidance for fiscal year 2026 to be in the range of 680 million to 700 million representing a 30 percent to 33 percent increase over fiscal year 2025Increasing adjusted free cash flow outlook to be at least 280 million in fiscal year 2026For the third quarter of fiscal year 2026 anticipate between 177 million to 182 million in operating income Wellpositioned for continued growth beyond fiscal year 2027 with strong market demand outlook for our broad portfolio of specialized solutions increasing productivity optimizing product mix and pricing actions The second quarter of fiscal year 2026 generated 1552 million of operating income said Tony R Thene Chairman and CEO of Carpenter Technology The record quarter was an increase of 310 percent over the previous second fiscal quarter The quarterly performance was driven by the SAO segment which continued to expand adjusted operating margins Reaching 331 percent in the quarter up from 283 percent in the second quarter a year ago the SAO segment realized 1746 million in operating income its best quarter on record Demand in our Aerospace and Defense enduse market continues to accelerate as customers gain confidence with the ramping build rates Notably we saw bookings for Commercial Aerospace increase 23 percent sequentially Given the strong demand outlook our customers continue to be focused on securing their supply To that end we completed negotiations on three additional longterm agreements with aerospace customers realizing significant value Given the strong demand environment and the visibility we have for the second half of the fiscal year we are raising our guidance to 680 million to 700 million This range represents a 30 percent to 33 percent increase over our record fiscal year 2025 earnings In addition we expect to generate at least 280 million in adjusted free cash flow in fiscal year 2026 With a strong balance sheet and meaningful adjusted free cash flow we will continue to take a balanced approach to capital allocation sustaining our current asset base to achieve our targets investing in high value growth initiatives like the recently announced brownfield capacity expansion and returning cash to shareholders To that end we executed 321 million in share repurchases in the quarter against our 4000 million repurchase program Looking over the long term our broad portfolio of specialized solutions increasing productivity optimizing product mix and pricing actions will continue to drive growth well into the future Together with our investments to accelerate growth we are positioned to achieve and exceed our goals over the longterm Financial Highlights Q2Q1Q2 in millions except per share amountsFY2026FY2026FY2025Net sales728073376769Net sales excluding surcharge a589160315480Operating income155215331189Net income10531225841Earnings per diluted share209243166Adjusted earnings per diluted share a233243166Net cash provided from operating activities1322392679Adjusted free cash flow a85934386a NonGAAP financial measures explained in the attached tables Net sales for the second quarter of fiscal year 2026 were 7280 million compared with 6769 million in the second quarter of fiscal year 2025 an increase of 511 million or 8 percent Net sales excluding surcharge were 5891 million for the current quarter an increase of 411 million or 8 percent from the same period a year ago Operating income for the second quarter of fiscal year 2026 was 1552 million compared to operating income of 1189 million in the prior year period Earnings per diluted share for the second quarter of fiscal year 2026 was 209 compared to earnings of 166 per diluted share in the prior year second quarter Excluding the special item adjusted earnings per diluted share in the second quarter of fiscal year 2026 was 233 Cash provided from operating activities in the second quarter of fiscal year 2026 was 1322 million compared to 679 million in the same quarter last year Adjusted free cash flow in the second quarter of fiscal year 2026 was 859 million compared to 386 million in the same quarter last year The increase in operating cash flow in the second quarter of fiscal year 2026 reflects higher earnings and improvements in working capital The improvement in adjusted free cash flow reflects higher operating cash flow partially offset by increased capital expenditures compared to the prior year period namely from the brownfield expansion Capital expenditures were 463 million in the second quarter of fiscal year 2026 compared to 293 million in the same quarter last year Under the Companys authorized share repurchase program of up to 4000 million the Company purchased 100000 shares of its common stock on the open market for an aggregate of 321 million during the quarter ended December31 2025 As of December31 2025 2169 million remains available for future purchases Total liquidity including cash and available revolver balance was 7308 million at the end of the second quarter of fiscal year 2026 This consisted of 2319 million of cash and 4989 million of available borrowings under the Companys Credit Facility Special Item During the quarter ended December 31 2025 the Company recorded debt extinguishment losses of 156 million or 120 million net of tax related to the redemption in full of its senior unsecured notes due July 2028 and March 2030 respectively including any interest and premiums due thereon Conference Call and Webcast Presentation Carpenter Technology will host a conference call and webcast presentation today January 29 2026 at 1000 am ET to discuss the financial results of operations for the second quarter of fiscal year 2026 Please dial 1 646 3071963 for access to the live conference call Access to the live webcast will be available at Carpenter Technologys website httpswwwcarpentertechnologycom and a replay will soon be made available at httpswwwcarpentertechnologycom Presentation materials used during this conference call will be available for viewing and download at httpswwwcarpentertechnologycom NonGAAP Financial Measures This press release includes discussions of financial measures that have not been determined in accordance with US Generally Accepted Accounting Principles GAAP A reconciliation of the nonGAAP financial measures to their most directly comparable financial measures prepared in accordance with GAAP accompanied by reasons why the Company believes the nonGAAP measures are important are included in the attached schedules About Carpenter Technology Carpenter Technology Corporation is a recognized leader in highperformance specialty alloy materials and process solutions for critical applications in the aerospace and defense medical energy transportation and industrial and consumer markets Founded in 1889 Carpenter Technology has evolved to become a pioneer in premium specialty alloys including nickel cobalt and titanium and material process capabilities that solve our customers current and future material challenges More information about Carpenter Technology can be found athttpswwwcarpentertechnologycom ForwardLooking Statements This press release contains forwardlooking statements within the meaning of the Private Securities Litigation Act of 1995 These forwardlooking statements are subject to risks and uncertainties that could cause actual results to differ from those projected anticipated or implied The most significant of these uncertainties are described in Carpenter Technologys filings with the Securities and Exchange Commission including its report on Form 10K for the fiscal year ended June30 2025 Form 10Q for the fiscal quarter ended September 30 2025 and the exhibits attached to those filings They include but are not limited to 1 the cyclical nature of the specialty materials business and certain enduse markets including aerospace defense medical energy transportation industrial and consumer or other influences on Carpenter Technologys business such as new competitors the consolidation of competitors customers and suppliers or the transfer of manufacturing capacity from the United States to foreign countries 2 the ability of Carpenter Technology to achieve cash generation growth earnings profitability operating income cost savings and reductions qualifications productivity improvements or process changes 3 the ability to recoup increases in the cost of energy raw materials freight or other factors 4 domestic and foreign excess manufacturing capacity for certain metals 5 fluctuations in currency exchange and interest rates 6 the effect of government trade actions including tariffs 7 the valuation of the assets and liabilities in Carpenter Technologys pension trusts and the accounting for pension plans 8 possible labor disputes or work stoppages 9 the potential that our customers may substitute alternate materials or adopt different manufacturing practices that replace or limit the suitability of our products 10 the ability to successfully acquire and integrate acquisitions 11 the availability of credit facilities to Carpenter Technology its customers or other members of the supply chain 12 the ability to obtain energy or raw materials especially from suppliers located in countries that may be subject to unstable political or economic conditions 13 Carpenter Technologys manufacturing processes are dependent upon highly specialized equipment located primarily in facilities in Reading and Latrobe Pennsylvania and Athens Alabama for which there may be limited alternatives if there are significant equipment failures or a catastrophic event 14 the ability to hire and retain a qualified workforce and key personnel including members of the executive management team management metallurgists and other skilled personnel 15 fluctuations in oil and gas prices and production 16 the impact of potential cyber attacks and information technology or data security breaches 17 the ability of suppliers to meet obligations due to supply chain disruptions or otherwise 18 the ability to meet increased demand production targets or commitments 19 the ability to manage the impacts of natural disasters climate change pandemics and outbreaks of contagious diseases and other adverse public health developments 20 geopolitical economic and regulatory risks relating to our global business including geopolitical and diplomatic tensions instabilities and conflicts such as the war in Ukraine the war between Israel and HAMAS the war between Israel and Hezbollah Houthi attacks on commercial shipping vessels and other naval vessels as well as compliance with US and foreign trade and tax laws sanctions embargoes and other regulations 21 challenges affecting the commercial aviation industry or key participants including but not limited to production and other challenges at The Boeing Company and 22 the consequences of the announcement maintenance or use of Carpenter Technologys share repurchase program Any of these factors could have an adverse andor fluctuating effect on Carpenter Technologys results of operations The forwardlooking statements in this document are intended to be subject to the safe harbor protection provided by Section 27A of the Securities Act of 1933 as amended the Securities Act and Section 21E of the Securities Exchange Act of 1934 as amended We caution you not to place undue reliance on forwardlooking statements which speak only as of the date of this press release or as of the dates otherwise indicated in such forwardlooking statements Carpenter Technology undertakes no obligation to update or revise any forwardlooking statements PRELIMINARYCONSOLIDATED STATEMENTS OF OPERATIONSin millions except per share dataUnauditedThree Months EndedSix Months EndedDecember 31December 312025202420252024NET SALES728067691461713945Cost of sales509749941027010407Gross profit2183177543473538Selling general and administrative expenses63158612611177Restructuring and asset impairment charges36Operating income1552118930862325Interest expense net102122217246Debt extinguishment losses156156Other income expense net06163516Income before income taxes1300105127482063Income tax expense247210470374NET INCOME105384122781689EARNINGS PER COMMON SHAREBasic210168455337Diluted209166452333WEIGHTED AVERAGE COMMON SHARES OUTSTANDINGBasic501502501502Diluted503507504507Cash dividends per common share020020040040 PRELIMINARYCONSOLIDATED STATEMENTS OF CASH FLOWSin millionsUnauditedSix Months EndedDecember 3120252024OPERATING ACTIVITIESNet income22781689Adjustments to reconcile net income to net cash provided from operating activitiesDepreciation and amortization721681Noncash restructuring and asset impairment charges25Debt extinguishment losses156Deferred income taxes8784Net pension expense72124Sharebased compensation expense11698Net loss on disposals of property plant and equipment0405Changes in working capital and otherAccounts receivable26061Inventories279807Other current assets15668Accounts payable13536Accrued liabilities732369Pension plan contributions115151Other postretirement plan contributions1718Other net2619Net cash provided from operating activities17141081INVESTING ACTIVITIESPurchases of property plant equipment and software889562Net cash used for investing activities889562FINANCING ACTIVITIESProceeds from issuance of longterm debt net of offering costs6921Payments on longterm debt7000Payments for debt extinguishment costs114Payments for debt issue costs41Dividends paid201202Purchases of treasury stock812403Proceeds from stock options exercised13239Withholding tax payments on sharebased compensation awards552320Net cash used for financing activities1667886Effect of exchange rate changes on cash and cash equivalents0603DECREASE IN CASH AND CASH EQUIVALENTS836370Cash and cash equivalents at beginning of year31551991Cash and cash equivalents at end of period23191621 PRELIMINARYCONSOLIDATED BALANCE SHEETSin millionsUnauditedDecember 31June 3020252025ASSETSCurrent assetsCash and cash equivalents23193155Accounts receivable net60355755Inventories82237938Other current assets983799Total current assets1756017647Property plant equipment and software net1394613594Goodwill22732273Other intangibles net6795Deferred income taxes8078Other assets11171181Total assets3504334868LIABILITIESCurrent liabilitiesAccounts payable27012674Accrued liabilities14272163Total current liabilities41284837Longterm debt69016954Accrued pension liabilities13871469Accrued postretirement benefits117125Deferred income taxes17221628Other liabilities934985Total liabilities1518915998STOCKHOLDERS EQUITYCommon stock28662862Capital in excess of par value34263543Reinvested earnings1917917102Common stock in treasury at cost49593958Accumulated other comprehensive loss658679Total stockholders equity1985418870Total liabilities and stockholders equity3504334868 PRELIMINARYSEGMENT FINANCIAL DATAin millions except pounds soldUnauditedThree Months EndedSix Months EndedDecember 31December 312025202420252024Pounds sold 000Specialty Alloys Operations46836447149158694814Performance Engineered Products2218220845024840Intersegment65675212661916Consolidated pounds sold48398461709482297738Net salesSpecialty Alloys OperationsNet sales excluding surcharge52734796106129905Surcharge1343121926002561Specialty Alloys Operations net sales661660151321212466Performance Engineered ProductsNet sales excluding surcharge77286216441785Surcharge6088123173Performance Engineered Products net sales83295017671958IntersegmentNet sales excluding surcharge154178334436Surcharge14182843Intersegment net sales168196362479Consolidated net sales728067691461713945Operating income lossSpecialty Alloys Operations1746135634522702Performance Engineered Products6970163143Corporate262236528516Intersegment01010104Consolidated operating income1552118930862325 The Company has two reportable segments Specialty Alloys Operations SAO and Performance Engineered Products PEP The SAO segment is comprised of Carpenters major premium alloy and stainless steel manufacturing operations This includes operations performed at mills primarily in Reading and Latrobe Pennsylvania and surrounding areas as well as South Carolina and Alabama The PEP segment is comprised of the Companys differentiated operations This segment includes the Dynamet titanium business the Carpenter Additive business and the Latrobe and Mexico distribution businesses The businesses in the PEP segment are managed with an entrepreneurial structure to promote flexibility and agility to quickly respond to market dynamics It is our belief this model will ultimately drive overall revenue and profit growth The pounds sold data above for the PEP segment includes only the Dynamet and Additive businesses Corporate costs are comprised of executive and director compensation and other corporate facilities and administrative expenses not allocated to the segments Also included are items that management considers not representative of ongoing operations and other specificallyidentified income or expense items The service cost component of net pension expense which represents the estimated cost of future pension liabilities earned associated with active employees is included in the operating results of the business segments The residual net pension expense is included in other income expense net and is comprised of the expected return on plan assets interest costs on the projected benefit obligations of the plans amortization of actuarial gains and losses and prior service costs PRELIMINARYNONGAAP FINANCIAL MEASURESin millions except per share dataUnauditedADJUSTED OPERATING MARGIN EXCLUDING SURCHARGE REVENUE AND SPECIAL ITEMThree Months EndedSix Months EndedDecember 31December 312025202420252024Net sales728067691461713945Less surcharge revenue1389128926952691Net sales excluding surcharge revenue589154801192211254Operating income1552118930862325Special itemRestructuring and asset impairment charges36Adjusted operating income1552118930862361Operating margin213176211167Adjusted operating margin excluding surcharge revenue and special item263217259210 ADJUSTED SEGMENT OPERATING MARGIN EXCLUDING SURCHARGE REVENUEThree Months EndedSix Months EndedDecember 31December 312025202420252024Specialty Alloys OperationsNet sales661660151321212466Less surcharge revenue1343121926002561Net sales excluding surcharge revenue52734796106129905Operating income1746135634522702Operating margin264225261217Adjusted operating margin excluding surcharge revenue331283325273 ADJUSTED SEGMENT OPERATING MARGIN EXCLUDING SURCHARGE REVENUEThree Months EndedSix Months EndedDecember 31December 312025202420252024Performance Engineered ProductsNet sales83295017671958Less surcharge revenue6088123173Net sales excluding surcharge revenue77286216441785Operating income6970163143Operating margin83749273Adjusted operating margin excluding surcharge revenue89819980 Management believes that removing the impact of raw material surcharge from operating margin provides a more consistent basis for comparing results of operations from period to period thereby permitting management to evaluate performance and investors to make decisions based on the ongoing operations of the Company In addition management believes that excluding the impact of special items from operating margin is helpful in analyzing the operating performance of the Company as these items are not indicative of ongoing operating performance Management uses its results excluding these amounts to evaluate its operating performance and to discuss its business with investment institutions the Companys board of directors and others ADJUSTED EARNINGS PER DILUTED SHARE EXCLUDING SPECIAL ITEMEarnings Before Income TaxesIncome Tax ExpenseNet IncomeEarnings Per Diluted ShareThree Months Ended December 31 2025 as reported13002471053209Special itemDebt extinguishment losses15636120024Three Months Ended December 31 2025 as adjusted14562831173233 Impact per diluted share calculated using weighted average common shares outstanding of 503 million for the three months ended December31 2025 ADJUSTED EARNINGS PER DILUTED SHARE EXCLUDING SPECIAL ITEMEarnings Before Income TaxesIncome Tax ExpenseNet IncomeEarnings Per Diluted ShareThree Months Ended December31 2024 as reported1051210841166Special itemNone reportedThree Months Ended December31 2024 as adjusted1051210841166 Impact per diluted share calculated using weighted average common shares outstanding of 507 million for the three months ended December31 2024 ADJUSTED EARNINGS PER DILUTED SHARE EXCLUDING SPECIAL ITEMEarnings Before Income TaxesIncome Tax ExpenseNet IncomeEarnings Per Diluted ShareSix Months Ended December 31 2025 as reported27484702278452Special itemDebt extinguishment losses15636120024Six Months Ended December 31 2025 as adjusted29045062398476 Impact per diluted share calculated using weighted average common shares outstanding of 504 million for the six months ended December31 2025 ADJUSTED EARNINGS PER DILUTED SHARE EXCLUDING SPECIAL ITEMEarnings Before Income TaxesIncome Tax ExpenseNet IncomeEarnings Per Diluted ShareSix Months Ended December 31 2024 as reported20633741689333Special itemRestructuring and asset impairment charges360927006Six Months Ended December 31 2024 as adjusted20993831716339 Impact per diluted share calculated using weighted average common shares outstanding of 507 million for the six months ended December31 2024 Management believes that earnings per share adjusted to exclude the impact of the special items is helpful in analyzing the operating performance of the Company as these items are not indicative of ongoing operating performance Management uses its results excluding these amounts to evaluate its operating performance and to discuss its business with investment institutions the Companys board of directors and others Three Months EndedSix Months EndedDecember 31December 31ADJUSTED FREE CASH FLOW2025202420252024Net cash provided from operating activities132267917141081Purchases of property plant equipment and software463293889562Adjusted free cash flow859386825519 Management believes that the presentation of adjusted free cash flow provides useful information to investors regarding our financial condition because it is a measure of cash generated which management evaluates for alternative uses It is managements current intention to use excess cash to fund investments in capital equipment acquisition opportunities and consistent dividend payments Additionally we will discretionarily use excess cash for a share repurchase program up to 4000 million of our outstanding common stock Adjusted free cash flow is not a US GAAP financial measure and should not be considered in isolation of or as a substitute for cash flows calculated in accordance with US GAAP PRELIMINARYSUPPLEMENTAL SCHEDULEin millionsUnauditedThree Months EndedSix Months EndedDecember 31December 31NET SALES BY ENDUSE MARKET2025202420252024EndUse Market Excluding Surcharge RevenueAerospace and Defense3850333877336837Medical57073411851468Energy384322810716Transportation173214352425Industrial and Consumer74467414941398Distribution170198348410Total net sales excluding surcharge revenue589154801192211254Surcharge revenue1389128926952691Total net sales728067691461713945 Investor InquiriesMedia InquiriesJohn HuyetteHeather Beardsley1 61020820611 6102082278jhuyettecartechcomhbeardsleycartechcom

Deep Sea Minerals Corp. Welcomes NOAA Deep-Sea Mapping Initiative Near American Samoa
Vancouver BC Jan 28 2026 GLOBE NEWSWIRE Deep Sea Minerals Corp CSE SEAS OTCPK CUHRF FSE X45 Deep Sea or the Company a subsea mineral exploration and development company focused on advancing critical mineral opportunities from the deep ocean today welcomed the announcement that the National Oceanic and Atmospheric Administration the NOAA will undertake a major deepsea mapping and characterization initiative in federal waters offshore American Samoa According to public reporting the NOAA program will focus on highresolution seabed mapping geological characterization and environmental baseline data collection across a substantial area of deepocean territory The initiative forms part of a broader US government effort to improve scientific understanding of domestic deepsea mineral systems and to inform future policy regulatory and resourceplanning decisions The mapping effort is being advanced under the US Department of Commerces offshore critical minerals agenda and follows recent Executive Branch actions emphasizing the strategic importance of securing longterm access to critical minerals necessary for national defense advanced manufacturing energy transition and emerging technologies We view NOAAs deepsea mapping program as a meaningful and necessary step in building the scientific and environmental foundation required for responsible subsea mineral exploration said James Deckelman CEO of Deep Sea Minerals Corp Highquality geological data and environmental baselines are essential prerequisites for any credible longterm development of deepsea mineral resources PRIORITIZING CRITICAL MINERALS amp NATIONAL SECURITY Deepsea mineral systems including polymetallic nodules and crustal deposits are understood to contain metals such as nickel cobalt copper manganese and rare earth elements which are integral to defense and aerospace systems energy storage and electrification infrastructure advanced manufacturing and robotics and artificial intelligence and highperformance computing supply chains As geopolitical competition for critical minerals intensifies and terrestrial supply chains face increasing constraints the United States and allied nations are devoting greater attention to domestic and alliedcontrolled sources of strategic materials including the deep seabed ABOUT DEEP SEA MINERALS CORP Deep Sea Minerals Corp is a subsea mineral exploration and development company focused on evaluating opportunities to support the future supply of critical minerals through the acquisition exploration and development of deepsea mineral assets The Companys strategy is centered on identifying jurisdictions and geological settings with potential exposure to polymetallic nodule systems which are recognized for containing combinations of metals that may be relevant to defense industrial manufacturing clean energy infrastructure advanced electronics and artificial intelligencerelated supply chains These seabed resources represent a largely undeveloped component of the global mineral supply base and are the subject of increasing policy scientific and regulatory attention worldwide As part of this process the Company has commenced earlystage engagement with selected governments and regulatory bodies in the Pacific Ocean region to assess potential pathways for future exploration initiatives subject to applicable international national and environmental frameworks For further information please see the Listing Statement a copy of which is available under the Companys profile on SEDAR at wwwsedarplusca SOCIAL MEDIA Website httpswwwdeepseamineralscorpcomFacebook httpswwwfacebookcomdeepseacorpInstagram httpswwwinstagramcomdeepseacorpX httpsxcomdeepseacorp LinkedIn httpswwwlinkedincomcompanydeepseacorp Youtube httpswwwyoutubecomdeepseacorp ON BEHALF OF THE BOARD James A DeckelmanJames A Deckelman Chief Executive Officer For further information please contact James A DeckelmanChief Executive OfficerPhone 12814671279Email infodeepseamineralscorpcom The Canadian Securities Exchange does not accept responsibility for the adequacy or accuracy of this release and has neither approved nor disapproved the contents of this press release ForwardLooking Statements This news release includes forwardlooking information that is subject to a number of assumptions risks and uncertainties many of which are beyond the control of the Company Forwardlooking statements may include but are not limited to statements relating to the completion of the Name Change the Companys plans objectives and strategies expected benefits of subsea mineral exploration and development and are subject to all of the risks and uncertainties normally incident to such events Although the Company believes the expectations expressed in such forwardlooking statements are based on reasonable assumptions such statements are not guarantees of future performance and actual results may differ materially from those in the forwardlooking statements