
24+ results for "EVs"
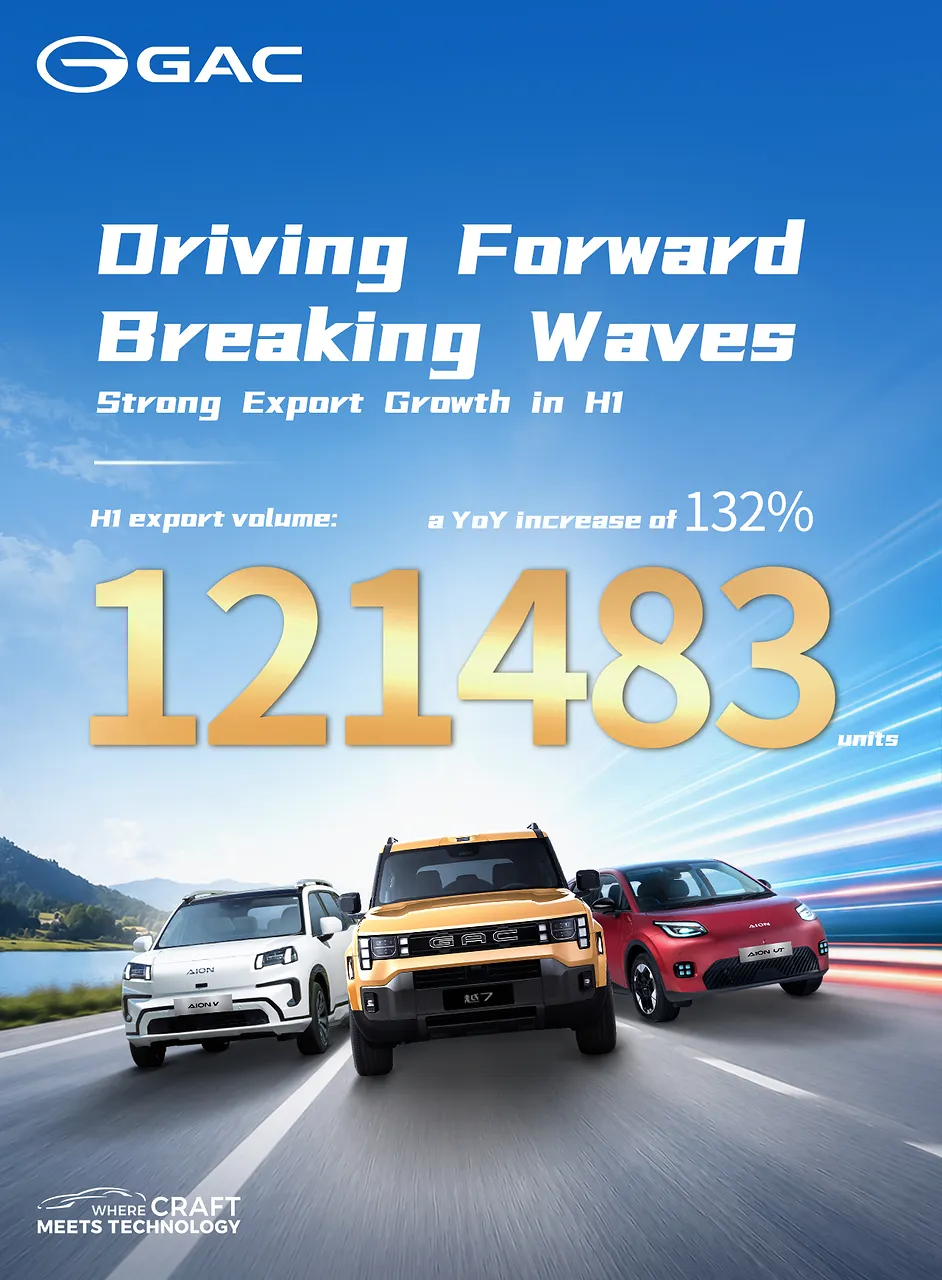
GAC International Posts First-Half Results with Outstanding Performance
GUANGZHOU, China , July 2, 2026 -- In the first half of 2026, GAC s overseas wholesale and end-user retail volumes doubled year-on-year. Total exports reached 121,483 units, nearly matching the full-year export volume of last year, with a significant 132% year-on-year increase, marking a major milestone. GAC achieved robust growth across all regions. In the Americas, Mexico delivered outstanding performance, with the AION ES and AION UT securing spots in the top ten in BEV sales rankings. Bolivia sustained its leading position as the top-selling Chinese passenger brand. Brazil, Colombia and other countries also recorded strong growth. In Asia-Pacific, Hong Kong SAR saw GAC claim the No.1 sales position for private EVs in April after subsidy phase-out, with cumulative market share from January to May exceeding 11%. Singapore ranked second among pure EV brands in April with nearly 7% share, and Thailand maintained its No.1 share in the electric taxi segment. Malaysia and Indonesia also posted notable growth. Europe accelerated its strategic expansion: the AION UT started production in Austria and made its European debut in Milan, followed by official entries into the UK and Spain, establishing an initial full-chain operation system. In the Middle East and Africa, the EMZOOM ranked first in Lebanon s B-segment SUV market, and the Middle East region saw a substantial year-on-year increase in cumulative sales.

ENNOVI Showcases Battery Cell Contacting System, including FPC Capabilities, Across All Major Cell Formats at The Battery Show Europe
SINGAPORE May 19 2026 ENNOVI a global leader in advanced interconnect and power solutions will showcase its battery cell contacting system CCS capabilities at The Battery Show Europe 2026 Hall 5 Booth C40 ENNOVI will demonstrate how its CCS technologies provide a unified approach that supports all major cell formats across a wide range of electrification applications Visitors to the booth can experience live demonstrations of CCS solutions across applications from EVs and 2wheelers to energy storage systems ESS and emerging robotics platforms

Tellus Power to Present at LD Micro Invitational XVI Investor Conference on May 19, 2026
IRVINE Calif May 19 2026 GLOBE NEWSWIRE Tellus Power Global Holding Limited Tellus Power or the Company a deep technology company building bidirectional energy transfer systems to power the physical AI economy will be attending the LD Micro Invitational XVI from May 1719 2026 at the Luxe Sunset Blvd Hotel in Los Angeles CA Tellus Power management is scheduled to present on Tuesday May 19 2026 at 330 pm Pacific Time in Track One with oneonone meetings to be held throughout the conference Qualified investors attending the conference may request to schedule oneonone meetings with Tellus Power management through the LD Micro team at registrationldmicrocom As AI electrification robotics and autonomous systems continue converging the infrastructure supporting energy transfer and intelligent grid interaction becomes increasingly critical said Mike Calise CEO of Tellus Power We look forward to discussing how Tellus Power is positioning itself at the center of this nextgeneration energy ecosystem and sharing our longterm vision with the investment community at LD Micro About Tellus Power Tellus Power is a deep technology company building bidirectional energy transfer systems to power the physical AI economy Our products unify fleet and passenger vehicle charging battery storage and vehicletogrid capabilities This infrastructure enables twoway control of high flowrate electrons through a grid edge energy system Deployed globally Tellus Power is enabling the convergence of electrification robotics autonomy and distributed energy resources Find out more at httpstelluspowergroupcom Company ContactCaitlin McCanncmccanntelluspowercom Media ContactJessica Starman MBAhellotelluspowercom
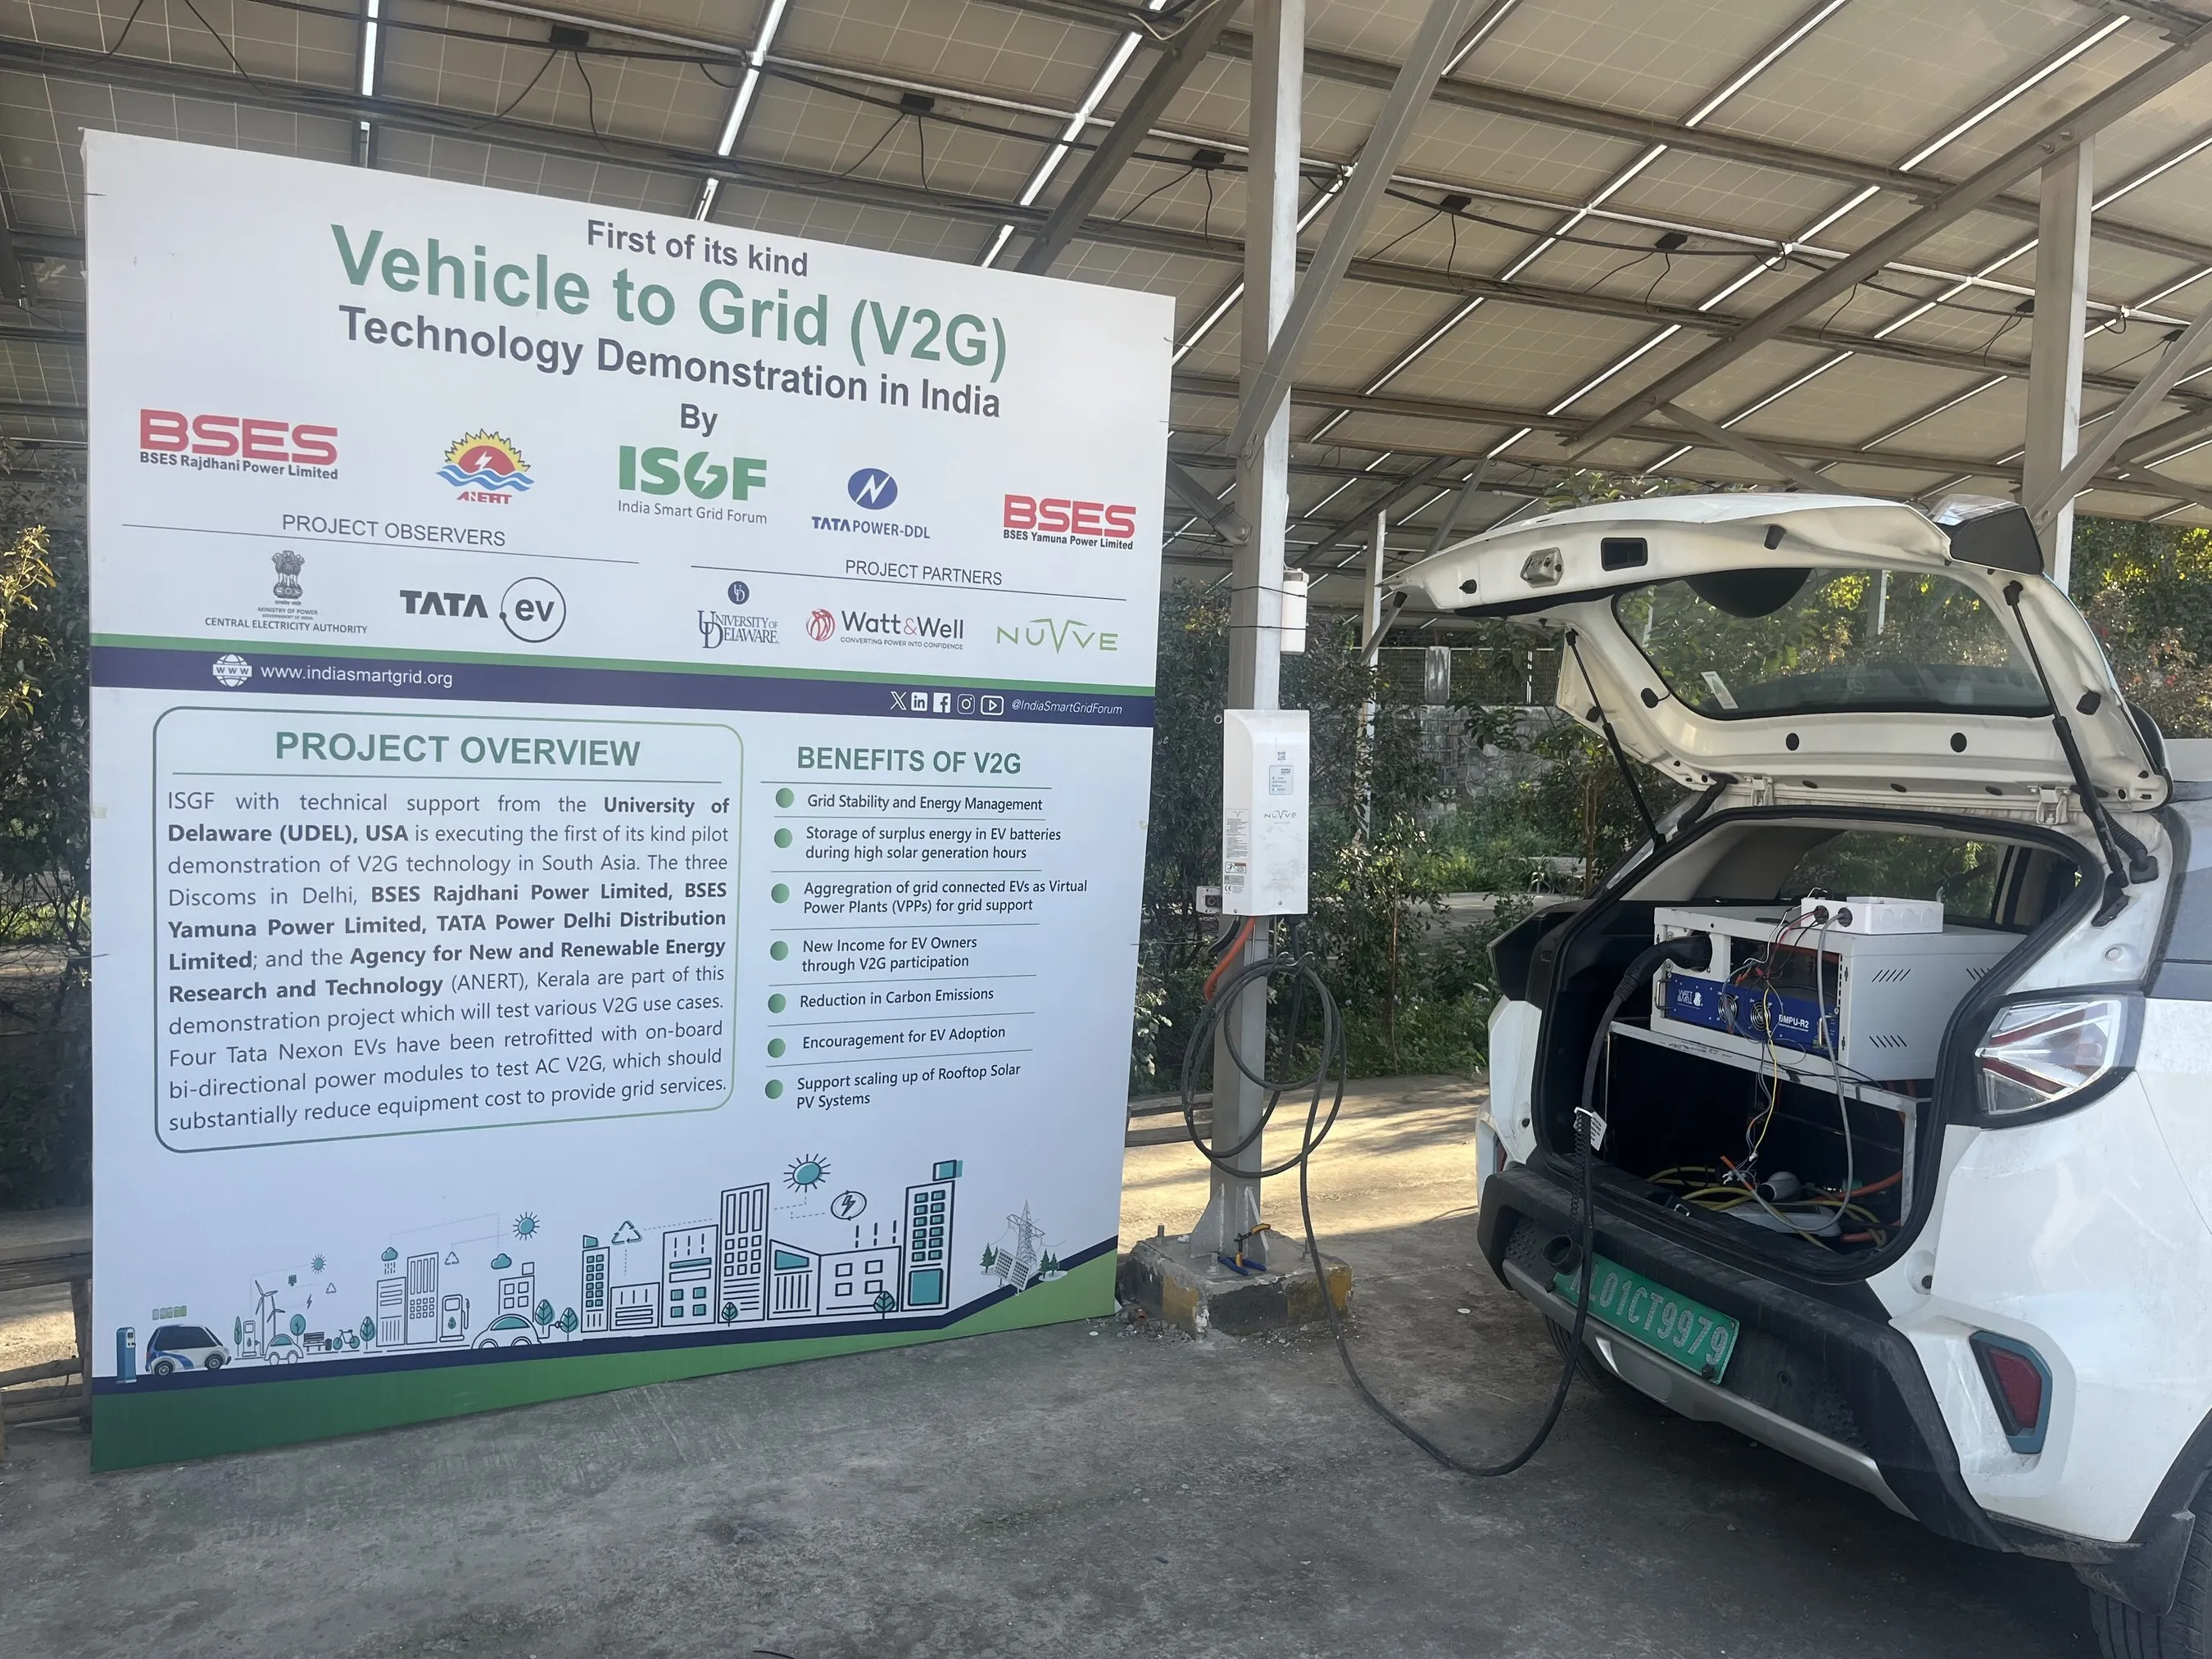
South Asia's First-ever Vehicle-to-Grid (V2G) Demonstration, Led by ISGF in Collaboration with its Technology and Utility Partners
NEW DELHI May 19 2026 South Asias first ever groundbreaking VehicletoGrid V2G Technology Demonstration in India implemented by India Smart Grid Forum ISGF marks a major advancement in smart Electric Vehicle EV charging and grid stability paving the way for a future of bidirectional energy flows between EVs and the power grid ISGF with its utility partners and technical support from the University of Delaware UDEL USA executed this firstofitskind Alternating Current AC V2G pilot demonstration in South Asia The demonstration project was implemented at BSES Rajdhani Power Limited BSES Yamuna Power Limited TATA Power Delhi Distribution Limited as well as at the Agency for New and Renewable Energy Research and Technology ANERT Kerala This pilot demonstration has tested a variety of V2G use cases and found it highly relevant for distributed renewable energy integration and grid stability

Syensqo first quarter 2026 results
Press releaseCommuniqu de presse Syensqo first quarter 2026 results Net sales of 14 billion increased 5 sequentially led by Specialty Polymers and Novecare Underlying EBITDA of 251 million increased 6 sequentially led by Specialty Polymers Full year 2026 underlying EBITDA outlook unchanged with capital expenditure lowered by up to 50 million Brussels May 15 2026 700am CET Q1 2026 Highlights Net sales of 14 billion reflect stable overall yearonyear volumes offset by the adverse impact of foreign exchange movements On a sequential basis net sales increased 5 driven by higher volumes led by Specialty Polymers and Novecare while pricing remained stableGross profit of 444 million reflects the yearonyear impact of foreign exchange movements on net sales as well as unfavorable product mix resulting in a gross margin of 317 Compared to the fourth quarter of 2025 gross profit increased by 15 and gross margin expanded by 260 basis points primarily driven by growth in Specialty PolymersUnderlying EBITDA of 251 million decreased 13 organically yearonyear resulting in an underlying EBITDA margin of 179 On a sequential basis underlying EBITDA increased 6 driven by Specialty Polymers Novecare and Composite MaterialsUnderlying profit attributable to Syensqo shareholders of 68 millionOperating cash flow of 82 million included the final payment of separation costs of approximately 30 millionCapital expenditures1 of 97 million decreased 44 yearonyearDivestment of the Oil amp Gas business unit completed in January with net proceeds of approximately 130 million Underlying millionQ1 2026Q1 2025Q4 2025YoY changeYoY organicQoQ changeNet sales139915111329741653Gross profit444495387104147Gross profit margin317328291110 bps260 bpsUnderlying EBITDA25130123616513165Underlying EBITDA margin179199177200 bps240 bps20 bpsOperating cash flow82176252535nmROCE LTM587162130 bps40 bps 1 Including Capex for the new ERP Implementation Mike Radossich CEO The first quarter of the year saw us deliver on our outlook in a dynamic external environment We also saw stable yearonyear volumes with improved momentum in Specialty Polymers supported by ongoing initiatives to drive longerterm growth as well as strong sequential growth in Novecare Overall we have seen improving order book trends in the second quarter which gives greater line of sight to deliver on our full year outlookWhile the ongoing conflict in the Middle East had no material impact on our first quarter performance it remains a source of uncertainty and we have taken actions to mitigate any direct impact on our operations Having completed my first 100 days as CEO and complemented by recent leadership appointments we are working at pace to drive more consistent execution sharpen our capital discipline as well as implement actions to accelerate growth and improve cashflow trajectory 2026 Outlook For Taking into account current visibility as well as current geopolitical environment we continue to expect low singledigit volume growth in 2026 led by Composite Materials Aligned with the outlook provided on February 26 2026 we continue to expect our first quarter EBITDA to be the lowest quarter of the year supported by improving order book trends in the second quarter as well as a gradual recovery in yearonyear volumes which is expected to drive stronger growth for the balance of the year Supporting our ongoing focus on capital discipline and further improving cashflow generation we have identified additional actions to reduce capital expenditure in 2026 including lower sustenance and ERPrelated spend Our full year 2026 outlook is now as follows Underlying EBITDA of approximately 11 billion unchangedOperating cash flow of approximately 700 million unchangedCapital Expenditure2 of approximately 450 million updated from prior outlook of less than 500 million The second quarter will include a cash outflow of approximately 165 million related to the payment of the 2025 dividend on May 18 2026 2 Including Capex for the new ERP Implementation More detailed information on the first quarter 2026 results available on the website Safe harborThis press release may contain forwardlooking information Forwardlooking statements describe expectations plans strategies goals future events or intentions The achievement of forwardlooking statements contained in this press release is subject to risks and uncertainties relating to a number of factors including general economic factors interest rate and foreign currency exchange rate fluctuations changing market conditions product competition the nature of product development impact of acquisitions and divestitures restructurings products withdrawals regulatory approval processes allin scenario of RampI projects and other unusual items Consequently actual results or future events may differ materially from those expressed or implied by such forwardlooking statements Should known or unknown risks or uncertainties materialize or should our assumptions prove inaccurate actual results could vary materially from those anticipated The Company undertakes no obligation to publicly update or revise any forwardlooking statements About SyensqoSyensqo is a science company developing groundbreaking solutions that enhance the way we live work travel and play Inspired by the scientific councils which Ernest Solvay initiated in 1911 we bring great minds together to push the limits of science and innovation for the benefit of our customers with a diverse global team of more than 13000 associates in 30 countriesOur solutions contribute to safer cleaner and more sustainable products found in homes food and consumer goods planes cars batteries smart devices and health care applications Our innovation power enables us to deliver on the ambition of a circular economy and explore breakthrough technologies that advance humanityLearn more at wwwsyensqocom Rsultats du premier trimestre 2026 de Syensqo Chiffre daffaires de 14 milliard en hausse de 5 squentiellement tir par Specialty Polymers et Novecare EBITDA sousjacent de 251 millions en hausse de 6 squentiellement tir par Specialty Polymers Perspectives 2026 pour lEBITDA sousjacent inchanges avec dpenses dinvestissement rduites jusqu 50 millions Bruxelles 15 mai 2026 700 CET Faits marquants T1 2026 Chiffre daffaires net de 14 milliard refltant des volumes globalement stables dune anne sur lautre compenss par des effets de change dfavorables Sur une base squentielle les ventes nettes ont augment de 5 soutenues par des volumes plus levs mens par Specialty Polymers et Novecare tandis que les prix sont rests stablesBnfice brut de 444 millions refltant limpact dune anne sur lautre des variations de change sur les ventes nettes ainsi quun mix produit dfavorable se traduisant par une marge brute de 317 Par rapport au quatrime trimestre 2025 le bnfice brut a augment de 15 et la marge brute sest amliore de 260 points de base principalement grce la croissance de Specialty PolymersEBITDA sousjacent de 251 millions en recul organique de 13 dune anne sur lautre ce qui se traduit par une marge dEBITDA sousjacent de 179 Sur une base squentielle lEBITDA sousjacent a augment de 6 tir par Specialty Polymers Novecare et Composite MaterialsLe bnfice net sousjacent attribuable aux actionnaires de Syensqo slve 68 millionsCash flow oprationnel de 82 millions incluant le paiement final des cots de sparation denviron 30 millionsLes dpenses dinvestissement1 de 97 millions ont diminu de 44 dune anne sur lautreLa cession du business unit Oil amp Gas a t finalise en janvier 2026 pour un montant net denviron 130 millions Sousjacents millions T1 2026T1 2025T4 2025Var annuelleVar orgVar sqChiffre daffaires net139915111329741653Bnfice brut444495387104147Marge brute317328291110 bps260 bpsEBITDA sousjacent25130123616513165Marge EBITDA sousjacent17919890200 bps240 bps20 bpsCash flow oprationnel82176252535nmROCE LTM587162130 bps40 bps 1 Y compris les dpenses dinvestissement lies la mise en uvre du nouvel ERP Mike Radossich CEO Au premier trimestre nous avons tenu notre cap dans un environnement externe dynamique Les volumes sont rests stables dune anne sur lautre avec une amlioration de la dynamique dans Specialty Polymers porte par les initiatives en cours visant stimuler la croissance long terme ainsi quune forte progression squentielle dans Novecare Dans lensemble nous observons une amlioration des tendances du carnet de commandes au deuxime trimestre ce qui renforce notre visibilit pour tenir nos perspectives pour lanne Si le conflit en cours au MoyenOrient na pas eu dimpact significatif sur nos performances du premier trimestre il demeure une source dincertitude et nous avons mis en uvre des actions pour attnuer tout impact direct sur nos oprations Aprs mes 100 premiers jours en tant que CEO et renforce par les nominations rcentes au sein du management nous avanons rapidement pour assurer une excution plus homogne renforcer notre discipline en matire dallocation du capital et dployer des actions destines acclrer la croissance et amliorer la trajectoire de gnration de trsorerie Perspectives 2026 Compte tenu de la visibilit actuelle ainsi que de lenvironnement gopolitique nous continuons de prvoir une croissance des volumes en 2026 dans le bas de la fourchette un chiffre tire par lactivit Composite Materials Conformment aux perspectives fournies le 26 fvrier 2026 nous continuons de prvoir que notre EBITDA du premier trimestre sera le plus faible trimestre de lanne port par la tendance actuelle du carnet de commandes ainsi que par une reprise progressive des volumes en glissement annuel qui devrait soutenir une croissance plus forte sur le reste de lexercice Dans le prolongement de notre discipline strictement applique en matire dallocation du capital et de lamlioration continue de la gnration de flux de trsorerie nous avons identifi des mesures supplmentaires visant rduire les dpenses dinvestissement en 2026 notamment via une diminution des dpenses de maintenance et des dpenses lies aux projets ERP Nos perspectives pour lensemble de lexercice 2026 se prsentent dsormais comme suit EBITDA sousjacent denviron 11 milliard inchangFlux de trsorerie provenant des activits oprationnelles denviron 700 millions inchangDpenses dinvestissement2 denviron 450 millions mise jour par rapport la prcdente indication infrieures 500 millions Le deuxime trimestre comprendra une sortie de trsorerie denviron 165 millions lie au paiement du dividende 2025 prvu le 18 mai 2026 2 Y compris les dpenses dinvestissement lies la mise en uvre du nouvel ERP Plus dinformations sur les rsultats du premier trimestre 2026 sont disponibles sur le site web Informations prospectivesCe communiqu peut contenir des informations prospectives Les dclarations prospectives dcrivent les attentes plans stratgies objectifs vnements futurs ou intentions La ralisation des dclarations prospectives contenues dans ce communiqu est sujette des risques et des incertitudes en raison dun certain nombre de facteurs y compris des facteurs conomiques dordre gnral les fluctuations des taux dintrt et des taux de change lvolution des conditions de march la concurrence des produits la nature du dveloppement dun produit limpact des acquisitions et des dsinvestissements des restructurations du retrait de certains produits du processus dapprobation rglementaire des scnarii globaux des projets de RampI et dautres lments inhabituels Par consquent les rsultats rels ou vnements futurs peuvent diffrer sensiblement de ceux exprims ou implicites dans ces dclarations prospectives Si de tels risques connus ou inconnus ou des incertitudes se concrtisent ou si nos hypothses savraient inexactes les rsultats rels pourraient diffrer considrablement de ceux anticips La socit ne sengage nullement mettre jour publiquement ses dclarations prospectives A propos de SyensqoSyensqo est une entreprise fonde sur la science qui dveloppe des solutions novatrices permettant damliorer notre faon de vivre de travailler de voyager et de nous divertir Inspirs par les congrs scientifiques initis par Ernest Solvay en 1911 nous runissons des talents brillants qui repoussent sans cesse les limites de la science et de linnovation au profit de nos clients avec plus de 13 000 employs Nous dveloppons des solutions qui contribuent offrir des produits plus srs plus propres et plus durables que lon retrouve dans lhabitat lalimentation et les biens de consommation les avions les voitures les batteries les appareils lectroniques et les soins de sant Notre force dinnovation nous permet de concrtiser lambition dune conomie circulaire et dexplorer des technologies rvolutionnaires qui feront progresser lhumanit Plus dinformations sur wwwsyensqocom Media RelationsmediarelationssyensqocomPerrine Marchal 32 478 32 62 72Laetitia Schreiber 32 487 74 38 07Investor RelationsinvestorrelationssyensqocomSherief Bakr 44 7920 575 989Robbin MooreRandolph 1 470 493 2433Loc Flament 32 478 69 74 20Eva Behaeghe 32 474 49 23 50 Attachments 20260515Syensqo first quarter 2026 resultsFR 20260515Syensqo first quarter 2026 resultsEN

Hormuz crisis shows clean energy is key to reducing the economic cost of fossil fuel dependence
The Energy Transitions Commission warns crisisdriven responses that reinforce fossil fuel dependence risk locking economies into higher costs and longterm vulnerability Accelerating clean energy deployment can displace the equivalent of all Hormuz flows over the next few years and is the most durable route to economic resilience and energy securityKEY FINDINGSFossil fuel systems transmit shocks clean energy systems absorb them Fossil systems depend on continuous commodity flows through concentratedchokepoints and transmit disruptions instantly through global prices In contrast 7090 of clean energy costs are upfront capital Once built solar wind batteries and grids deliver energy for years regardless of market disruptionIf sustained elevated fossil fuel prices could add 12trn in annual gross oil and gas expenditure That is comparable to the annual clean energy investment gap of 15trn between current investment levels of 2trn and the 35trn needed to build a net zero and more resilient energy system all the way through to 2050New fossil infrastructure now would lock in the next shock New oil and gas fields typically take 510 years to reach production Rooftop solar and heat pumps can scale within monthsEVs are already structurally reducing oil demand EV deployment alone could displace around 5 mbd by 2030 and 910 mbd by 2035 equivalent to roughly half of precrisis Hormuz oil flows On top of already surging clean technology demand a coordinated clean energy response could displace 20 of global oil and over 30 of global gas demand by 2035 permanently reducing exposure to future shocks

ProLogium Wins Edison Award for the Third Time
NextGeneration SolidState Battery Technology Earns Global Recognition AgainTAIPEI Taiwan April 24 2026 GLOBE NEWSWIRE On April 16 the Edison Awards widely regarded as the Oscars of Innovation held its annual gala in Fort Myers Florida USA On this global stage where leading technology companies showcase their RampD excellence ProLogium was honored with a Gold Award in the Battery Materials amp Manufacturing category under Material Science for its proprietary Gen 4 Technology Superfluidized AllInorganic SolidState Lithium Ceramic Battery This marks ProLogiums third Edison Award reaffirming international recognition of its continued innovation in nextgeneration solidstate batteries from safety mechanisms and material systems to manufacturing platforms It further validates that ProLogiums battery platform built on a superfluidized allinorganic electrolyte all ceramic separator and 100 silicon anode is advancing solidstate batteries toward industrialization with an optimal balance of safety performance cost and manufacturability 3rd Recognition Highlights a Continuous Technology RoadmapThis latest recognition represents a sustained evolution of ProLogiums technology roadmap Following its 2021 award for the Active Safety Mechanism ASM material ProLogium has continuously advanced both materials and cell architecture Between 2022 and 2024 ProLogium completed the synthesis and development of an ASMembedded allinorganic solidstate electrolyte From 2024 to 2025 it achieved a breakthrough in superfluidization technology enabling excellent interfacial contact and electrical performance without external pressure From ASM stabilizing cathode and anode active materials and eliminating flammable organic materials to resolving interfacial challenges significantly enhancing ionic conductivity to 56 times that of sulfide and liquid electrolytes and overcoming lowtemperature conductivity and manufacturability barriers this technology pathway is steadily advancing nextgeneration solidstate batteries from material innovation toward engineering validation and industrial deployment This progression also makes ProLogiums third Edison Award recognition more directly connected to its commercialization journey Three Key Breakthroughs in Gen 4 Technology with Verifiable Performance1 Interfacial stability and high conductivity without external pressureElectrolyte performance depends on both high ionic conductivity and high ionic transference number ProLogiums superfluidized allinorganic solidstate electrolyte achieves a nearunity transference number 100 comparable to solid sulfide electrolytes while delivering ionic conductivity of 57 mScm over 5x higher than conventional liquid and solid sulfide electrolytes 1012 mScm This outstanding performance is achieved without external pressure enabled by the nonNewtonian fluid behavior of superfluidized electrolyte In contrast to mainstream solid sulfide batteries that rely on substantial external pressure to sustain performance amp interfacial stability our ProLogiums Gen 4 technology operates effectively under pressurefree conditions By integrating the best attributes of liquid and solid systems ProLogium unlocks decisive advantages in energy density design flexibility and cost efficiency 2 High energy density fast charging and lowtemperature performance simultaneously achievedThe battery delivers 860 WhL volumetric energy density supports 6080 charge in 46 minutes and maintains 90 performance efficiency at 20C comparable to room temperature These metrics directly address the core electrification challenges of range charging efficiency and lowtemperature durability 3 Dualfunction electrolyte integrates safety and battery performanceA key differentiator of ProLogiums battery platform is its dualfunction electrolyte The material is intrinsically nonflammable and can release ASM in situ under high temperature and voltage conditions passivating cathode and anode active materials and eliminating thermal chain reactions to prevent thermal runaway This fundamental safety platform supports the use of highenergy density active materials delivering cell energy density of 860940 WhL without increasing risk of thermal runaway Balancing Safety Performance Cost and ManufacturabilityThe challenge of commercializing solidstate batteries lies not in maximizing a single parameter but in achieving multiple conditions simultaneously ProLogiums superfluidized allinorganic solidstate lithium ceramic battery integrates intrinsic and active safety combining a nonflammable electrolyte with ASM to eliminate the root causes of battery fires while supporting 94 highnickel cathode and 100 silicon anode Importantly this performance is not achieved through costly materials or complex processes The electrolyte contains no rare materials is recyclable and can be produced using industrialgrade 985 raw materials refined via superfluid processing to batterygrade 999 purity bringing BOM costs close to those of conventional liquid and organic electrolytes Manufacturing can also reduce 3040 of process steps and 6070 of dry room requirements lowering CAPEXOPEX and accelerating mass production readiness From EVs to Aerospace and Energy Storage Expanding the RealWorld Applications of Energy TransitionThis technology platform is now advancing into applications including electric vehicles energy storage and aerospace with further extensions to aircraft eVTOL maritime humanoid robots and largescale energy storage systems Its impact goes beyond improving individual product performance it addresses key industry challenges such as range anxiety lowtemperature degradation slow charging and thermal runaway risks By advancing safety durability and manufacturability simultaneously it enables faster deployment of lowcarbon solutions across transportation industry and energy systems Vincent Yang Founder and CEO of ProLogium statedWinning the Edison Award for the third time and receiving another Gold Award is a strong recognition of our longterm commitment to nextgeneration battery technology For us the value of innovation lies not only in advancing performance metrics but in building a reliable scalable and sustainable path to industrialization ProLogium will continue to develop safer more efficient and highly manufacturable technology platforms to support the global transition of transportation industry and energy systems CONTACT samprologiumcom
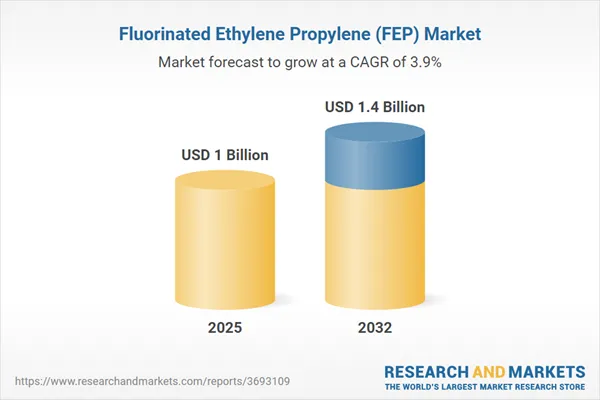
Fluorinated Ethylene Propylene (FEP) Global Market Overview 2026: Geopolitical Conflicts Could Impact FEP Feedstock and Logistics
Fluorinated Ethylene Propylene FEP Market Fluorinated Ethylene Propylene FEP Market Dublin April 23 2026 GLOBE NEWSWIRE The Fluorinated Ethylene Propylene FEP A Global Market Overview has been added to ResearchAndMarketscoms offering The global FEP market is experiencing steady growth due to its critical role in advanced sectors Valued at approximately US104 billion in 2025 it is projected to reach 57 thousand metric tons and US137 billion by 2032 with a CAGR of 41 This growth is fueled by increased use in wire cable electronics and chemical processing Demand is further bolstered by the expansion of data infrastructure telecommunications and highspeed connectivity alongside the rise of electric vehicles renewable energy systems and photovoltaic installations Key market players include 3M Company Daikin Industries Ltd Dongyue Group Limited Gujarat Fluorochemicals Limited The Chemours Company and Zhejiang Juhua Co Ltd These companies are expanding capacities innovating products and diversifying regionally to fortify their competitive edge Geopolitical Influence The production of FEP resin is closely tied to energy and petrochemical feedstocks making its value chain susceptible to geopolitical fluctuations The current tensions involving Iran may disrupt petrochemical supply chains and impact logistics and pricing for FEP resin Analysts are monitoring energy markets trade flows and sector demand to assess influences on the market outlook for 2026 Regional and Sectoral Market Dynamics AsiaPacific leads the global market with a 474 share in 2025 driven by robust electronics manufacturing wire amp cable production and growth in photovoltaic and semiconductor industries across China Japan South Korea and Taiwan North America follows as the secondlargest region The AsiaPacific market is also the fastestgrowing with a 60 CAGR attributed to industrial growth electrification and investments in EVs and renewable energy The Electrical amp Electronics sector holds sway with a 636 market share US6604 million in 2025 propelled by highspeed data cables telecom infrastructure and advanced insulation applications The Chemical Processing segment ranks second linked to FEPs chemical inertness and rising utilization in corrosionresistant apparatus Rapid growth is anticipated in Automotive amp Transportation registering a 45 CAGR indicative of electrification trends and EV demand Report Scope and Metrics This comprehensive study on FEP analyzes global and regional markets by enduse sector from 2022 to 2032 providing insights into volume Metric Tons and value US It profiles major corporations and tracks company product and capacity developments painting a clear picture of the FEP industry Important metrics include the base year 2025 and forecast period 20252032 The geographic analysis covers North America Europe AsiaPacific South America and the Rest of World while the enduse sectors include Automotive amp Transportation Electrical amp Electronics MechanicalIndustrial Chemical Processing and others Key Attributes Report AttributeDetailsNo of Pages235Forecast Period20252032Estimated Market Value USD in 20251 BillionForecasted Market Value USD by 203214 BillionCompound Annual Growth Rate39Regions CoveredGlobal Companies Featured 3M CompanyDaikin Industries LtdDongyue Group LimitedGujarat Fluorochemicals LimitedJiangsu Meilan Chemical Co LtdJinhua Yonghe Fluorochemical Co LtdShanghai Huayi 3F New Materials Co LtdThe Chemours CompanyZhejiang Juhua Co Ltd For more information about this report visit httpswwwresearchandmarketscomrv57c87 About ResearchAndMarketscomResearchAndMarketscom is the worlds leading source for international market research reports and market data We provide you with the latest data on international and regional markets key industries the top companies new products and the latest trends Attachment Fluorinated Ethylene Propylene FEP Market CONTACT CONTACT ResearchAndMarketscom Laura WoodSenior Press Manager pressresearchandmarketscom For EST Office Hours Call 19173000470 For US CAN Toll Free Call 18005268630 For GMT Office Hours Call 35314168900

PyroGenesis Produces Battery-Grade Graphite from Carbon Black Using Proprietary Plasma System
Independent material testing shows batterygrade graphitization level of over 96MONTREAL April 23 2026 GLOBE NEWSWIRE PyroGenesis Inc PyroGenesis or the Company TSX PYR OTCQX PYRGF FRA 8PY1 a leader in ultrahigh temperature processes and engineering innovation and a plasmabased technology provider to heavy industry amp defense announces further to itspress release dated April 21 2026 the successful production of high quality batterygrade graphite from carbon black using a proprietary plasma process Of note the carbon black used to produce the graphite was itself produced by PyroGenesis in a firstever achievement where both a natural gaspowered and a methanepowered plasma torch acted as the sole feedstock ie the gas flowing through the torch to create plasma acts as the feedstock that is converted into carbon black With this process the plasma gas feedstock was directly converted into carbon black and hydrogen without the need for secondary raw material feedstock gases or additives The second step announced today converts the carbon black directly to graphite under high temperature provided by a plasma torch using an inert gas in an inert atmosphere The resulting graphite surpassed 96 graphitization as confirmed by an independent testing lab The full 2step system was designed by PyroGenesis on behalf of its client a Canadian company exploring alternative use of carbons for commercial applications and effectively produces graphite from a plasma torch with no additional feedstock or additives beyond the methane or natural gas used to create the plasma PyroGenesis has a 10 royalty on future gross revenues generated from the clients initial commercial graphite production plant and a 5 royalty on any subsequent plants In addition PyroGenesis is the exclusive plasma supplier and engineering service provider for the construction of any such plants As previously announced press release dated September 3 2024 this project began with a first phase contract valued at 1 million for the design and delivery of a customized pilotscale plasma reactor and associated testing infrastructure The successful results announced today confirm that the PyroGenesisdesigned plasmabased process produces graphite at an exceptionally high grade with a graphitization level of 96 Graphite for lithiumion battery anodes typically requires a graphitization level between 90 to 951methane or natural gas can be used as a combined plasma gas and feedstock to produce carbon black which can then be converted into graphite also using plasma with both materials meeting batterygrade standards PyroGenesis achievement in developing a new graphite production process has significant strategic importance due not only to the growing demand for graphite but also in securing the graphite supply chain domestically said Mr P Peter Pascali President and CEO of PyroGenesis The graphite industry is heavily dominated by China who controls 95 or more of the global batterygrade graphite supply2 This level of control amounts to a major vulnerability for North American manufacturers who need graphite especially highgrade graphite for use in batteries for EVs consumer electronics and large energy storage systems The research and engineering being conducted by our fastgrowing Materials Production vertical continues to underscore how local innovation using electric plasma as the primary technology can help solve many of the critical material and supply chain challenges facing both the heavy industry and manufacturing sectors Next Steps The next phase will focus on advancing towards a commercialscale system to produce highquality graphite INDUSTRY AND MARKET CONTEXT Graphite is valued for its unique combination of thermal conductivity electrical conductivity hightemperature resistance and lubricating properties making it a critical component in both modern technology sectors as well as for traditional manufacturing Graphite is used across a broad range of industrial applications including batteries refractories lubricants powdered metals brake linings and steelmaking with battery demand becoming an increasingly important growth driver The International Energy Agency reported that graphite demand rose by between 6 and 8 in 2024 mainly due to growth in electric vehicles battery storage renewables and grid infrastructure Grand View Research estimates the global graphite market at approximately US1329 billion in 2025 projected to grow to approximately US2387 billion by 20333 Graphite is recognized by the Government of Canada as a critical mineral4 About PyroGenesis Inc PyroGenesis leverages 35 years of plasma technology leadership to deliver advanced engineering solutions to energy propulsion destruction process heating emissions and materials development challenges across heavy industry and defense Its customers include global leaders in aluminum aerospace steel iron ore utilities environmental services military and government From its Montreal headquarters and local manufacturing facilities PyroGenesis engineers scientists and technicians drive innovation and commercialization of energy transition and ultrahigh temperature technology PyroGenesis operations are ISO 90012015 and AS9100D certified with ISO certification maintained since 1997 PyroGenesis shares trade on the TSX PYR OTCQX PYRGF and Frankfurt 8PY1 stock exchanges Cautionary and ForwardLooking Statements This press release contains forwardlooking information and forwardlooking statements collectively forwardlooking statements within the meaning of applicable securities laws In some cases but not necessarily in all cases forwardlooking statements can be identified by the use of forwardlooking terminology such as plans targets expects or does not expect is expected an opportunity exists is positioned estimates intends assumes anticipates or does not anticipate or believes or variations of such words and phrases or state that certain actions events or results may could would might will or will be taken occur or be achieved In addition any statements that refer to expectations projections or other characterizations of future events or circumstances contain forwardlooking statements Forwardlooking statements are not historical facts nor guarantees or assurances of future performance but instead represent managements current beliefs expectations estimates and projections regarding future events and operating performance Forwardlooking statements are necessarily based on a number of opinions assumptions and estimates that while considered reasonable by PyroGenesis as of the date of this release are subject to inherent uncertainties risks and changes in circumstances that may differ materially from those contemplated by the forwardlooking statements Important factors that could cause actual results to differ possibly materially from those indicated by the forwardlooking statements include but are not limited to the risk factors identified under Risk Factors in PyroGenesis latest annual information form and in other periodic filings that it has made and may make in the future with the securities commissions or similar regulatory authorities all of which are available under PyroGenesis profile on SEDAR at wwwsedarplusca These factors are not intended to represent a complete list of the factors that could affect PyroGenesis However such risk factors should be considered carefully There can be no assurance that such estimates and assumptions will prove to be correct You should not place undue reliance on forwardlooking statements which speak only as of the date of this release PyroGenesis undertakes no obligation to publicly update or revise any forwardlooking statement except as required by applicable securities laws Neither the Toronto Stock Exchange its Regulation Services Provider as that term is defined in the policies of the Toronto Stock Exchange nor the OTCQX Best Market accepts responsibility for the adequacy or accuracy of this press release For further information contact irpyrogenesiscom or visit httpwwwpyrogenesiscom 1 httpswwwthermofishercomblogmaterialshowtodeterminethedegreeofgraphitizationinbatteryanodes2 httpsenergystanfordedunewsconfrontingchinasgripgraphitebatteries3 httpswwwgrandviewresearchcomindustryanalysisgraphitemarketreport4 httpswwwcanadacaencampaigncriticalmineralsincanadacanadiancriticalmineralsstrategyhtmla3
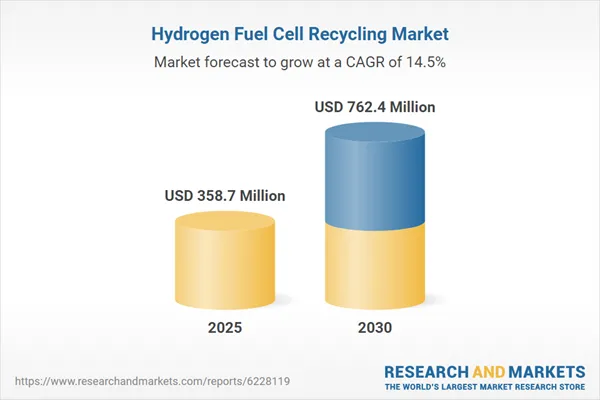
Hydrogen Fuel Cell Recycling Report 2026: Market to More than Double to Reach $762.4 Million by 2030, Rising at a CAGR of 14.5% Driven by Growing Demand for FCEVs, Government Regulations, & Awareness
Key market opportunities in the hydrogen fuel cell recycling sector include advancements in technology regulatory support regional expansion and growing sustainability trends The market is segmented by fuel cell type process and source offering prospects for targeted growth especially in emerging markets and through strategic partnerships Hydrogen Fuel Cell Recycling Market Hydrogen Fuel Cell Recycling Market Dublin April 23 2026 GLOBE NEWSWIRE The Hydrogen Fuel Cell Recycling Market report has been added to ResearchAndMarketscoms offeringThe Hydrogen Fuel Cell Recycling Market was valued at USD 3587 Million in 2025 and is projected to reach USD 7624 Million by 2030 rising at a CAGR of 145This report also covered market analysis for leading countries including the US Canada China Japan Germany France and the UK The study also covers leading companies with company overviews financial information product types and key developments The report includes patent analysis and a competitive landscape which enables the reader to understand the competitive environment more preciselyThe report is prepared in an easytounderstand format with tables and figures to illustrate historical current and future market scenarios It includes global revenue million using 2024 as the base year estimated data for 2025 and projected data for 2026 through 2030Report Highlights Analyses of the global market trends with revenue data for 2024 2025 forecasts for 2028 2029 and projected CAGRs through 2030Estimates of the market size and revenue growth prospects accompanied by a market share analysis by fuel cell type recycling process source and regionFacts and figures pertaining to market dynamics technological advances regulations prospects and the impact of macroeconomic variablesInsights derived from Porters Five Forces model as well as global supply chain analysesPatent review featuring key granted and published patentsAnalysis of the industry structure including companies market shares and rankings product mappings strategic initiatives MampA activity and a venture funding outlookOverview of sustainability trends and ESG developments with emphasis on consumer attitudes as well as the ESG risk ratings and practices of leading companies Profiles of the Leading Global Companies Ballard Power SystemsBloom EnergyElectrocycling GmbHFuelcell Energy IncHensel Recycling GroupHeraeus Precious MetalsJohnson MattheyTanaka Precious Metal Group Co LtdTechemet LtdUmicore Key Attributes Report AttributeDetailsNo of Pages93Forecast Period2025 2030Estimated Market Value USD in 20253587 MillionForecasted Market Value USD by 20307624 MillionCompound Annual Growth Rate145Regions CoveredGlobal Key Topics Covered Chapter 1 Executive Summary Market OutlookScope of the ReportMarket SummaryMarket Dynamics and Growth FactorsSegmental AnalysisRegional Insights and Emerging MarketsConclusion Chapter 2 Market Overview Current Market Overview and Future ScenarioCurrent Market OverviewFuture ScenarioPorters Five Forces AnalysisMacroeconomic Factors AnalysisRole of Hydrogen and Fuel Cells in Advancing LowEmission Energy SystemsGlobal Transition Toward Green EnergyImpact of US Tariffs on the Global Hydrogen Fuel Cell Recycling MarketRegulatory Frameworks and Government InitiativesUSGermanyUKChinaJapanSouth Korea Chapter 3 Market Dynamics Market DynamicsMarket DriversGrowing Demand for FCEVsSupportive Government Regulations and IncentivesGrowing Awareness for Reducing Carbon EmissionsMarket ChallengesRestraintsHigh Cost of Hydrogen Storage and DistributionCrude Oil Price FluctuationsMarket OpportunitiesGrowing Demand for Clean Energy SourcesFuel Cell Potential for Microgrid Application Chapter 4 Emerging Technologies and Developments OverviewKey Emerging Technologies for Hydrogen Fuel Cell RecyclingUltrasoundBased Disassembly for Platinum RecoveryElectrochemical Dissolution and Selective Metal SeparationDigital Traceability and ClosedLoop Recycling PlatformsPatent AnalysisKey Findings Chapter 5 Market Segment Analysis Segmentation BreakdownHydrogen Fuel Cell Recycling Market by Fuel Cell TypeKey TakeawaysProtonExchange Membrane Fuel Cell PEMFCSolid Oxide Fuel Cell SOFCOthersHydrogen Fuel Cell Recycling Market by Recycling ProcessKey TakeawaysChemical ProcessThermal ProcessOther Recycling ProcessesHydrogen Fuel Cell Recycling Market by SourceKey TakeawaysStationary SourceTransportation SourcePortableGeographic BreakdownHydrogen Fuel Cell Recycling Market by RegionKey TakeawaysNorth AmericaEuropeAsiaPacificRest of the World Chapter 6 Competitive Intelligence OverviewMarket Ranking AnalysisJohnson MattheyUmicoreHeraeus Precious MetalsTanaka Precious Metal Group Co LtdHensel Recycling GmbHKey DevelopmentsStrategic Analysis Chapter 7 Appendix For more information about this report visit httpswwwresearchandmarketscomrjzsmyu About ResearchAndMarketscomResearchAndMarketscom is the worlds leading source for international market research reports and market data We provide you with the latest data on international and regional markets key industries the top companies new products and the latest trends Attachment Hydrogen Fuel Cell Recycling Market CONTACT CONTACT ResearchAndMarketscom Laura WoodSenior Press Manager pressresearchandmarketscom For EST Office Hours Call 19173000470 For US CAN Toll Free Call 18005268630 For GMT Office Hours Call 35314168900

2025 Chemical Industry Research Review Report with Global Market Forecast to 2030
Key market opportunities include rising demand for sustainable specialty chemicals in water treatment cosmetics and elastomers driven by environmental regulations Growth in highpurity solvents refrigerants and highpurity quartz is supported by advancements in pharmaceuticals semiconductors and green technologiesDublin April 23 2026 GLOBE NEWSWIRE The 2025 Chemical Research Review report has been added to ResearchAndMarketscoms offering The global chemical industry is constantly evolving It forms the basis of modern manufacturing and supplies essential materials that drive innovation across sectors such as transportation electronics energy healthcare and consumer goods The rising emphasis on sustainability the circular economy and improved performance is boosting the demand for various specialty chemicals The use of AI and automation is enhancing production efficiency and improving supply chain resilienceKey Market Valuations The global market for specialty water treatment chemicals is estimated to grow from 424 billion in 2025 to reach 579 billion by the end of 2030 at a compound annual growth rate CAGR of 64 from 2025 through 2030The global market for elastomers was valued at 1127 billion in 2024 The market is projected to grow from 1204 billion in 2025 to reach 1777 billion by 2030 at a compound annual growth rate CAGR of 81 from 2025 to 2030The global market for highpurity solvents is estimated to grow from 327 billion in 2025 and forecast to reach 45 billion by the end of 2030 at a compound annual growth rate CAGR of 66 from 2025 through 2030 Several segments within the chemical industry are expected to grow These include specialty water treatment chemicals elastomers highpurity solvents refrigerants flameretardant chemicals highpurity quartz engineered wood adhesives acrylic coatings polymers for electric vehicles EVs polyester resins and chemicals for cosmetics and toiletriesThe chemical market for cosmetics and toiletries is expanding driven by rising consumer demand for safer more sustainable formulations This market includes various chemicals such as surfactants emollients and preservatives The increasing need for biobased nontoxic and dermatologically safe chemical formulations is driving growth in this segmentThe demand for water treatment chemicals is rising due to growing concerns about industrial wastewater management water scarcity and environmental regulations related to wastewater generation and treatment Water treatment chemicals are used across sectors such as wastewater treatment power generation oil and gas and manufacturing Water reuse and zero discharge systems are also contributing to market growth especially in regions that experience water shortagesElastomers are used in many applications across the automotive construction healthcare and consumer goods sectors Their flexibility durability and resistance to heat and chemicals make them crucial for tires seals gaskets and medical devices As the automotive industry transitions to electric mobility the demand for highperformance elastomers in EV components such as battery seals and thermal management systems is rising sharplyHighpurity solvents are increasingly used across industries such as the pharmaceutical electronics and specialty chemicals sectors As the semiconductor and pharmaceutical industries expand globally particularly in AsiaPacific demand for ultrahighpurity solvents is bound to increase The refrigerants market has undergone a major shift in recent years driven by the need to phase out hydrofluorocarbons This transition favors hydrofluoroolefins and natural refrigerants such as CO2 and ammonia which have low global warming potentials GWPsHighpurity quartz is an essential component in hightech products especially in the semiconductor and solar industries The excellent thermal properties of highpurity quartz make it an essential component in the production of silicon wafers and other electronic components Flameretardant chemicals are gaining importance in the market as a means of improving fire safety across a range of industries including construction electronics textiles and transportation There has been a major increase in demand for flameretardant chemicals to meet fire safety regulations and protect the environmentAcrylic coatings offer excellent weather resistance durability and appearance They are commonly used in construction automotive and industrial applications Waterborne acrylic coatings have gained popularity in recent years due to their low volatile organic compound VOC content and compliance with environmental regulations Adhesives for engineered wood products are gaining popularity as green building materials become more prevalent These adhesives are used in products such as plywood particleboard and crosslaminated timberPolyester resins are used across industries including construction marine automotive and packaging These materials are costeffective have good mechanical properties and can be used for various applications such as composites and fiberreinforced plastics Polymers for electric vehicles are emerging as automakers increasingly use lightweight materials to boost vehicle energy efficiency and driving range These polymers are used in battery enclosures interior parts thermal insulation and electrical systemsKey Topics Covered Chapter 1 Foreword Research Review Scope Chapter 2 Global Markets for Chemicals for Cosmetics Executive SummaryMarket OutlookScope of ReportMarket SummaryMarket OverviewSupply Chain AnalysisMarket DynamicsMarket DriverMarket OpportunityMarket ChallengeRegulatory LandscapeRegulations on Personal Care Ingredients by CountryRegionEmerging TechnologiesTechnological Advances and TrendsMarket Segmentation AnalysisMarket Analysis by FunctionGeographic BreakdownMarket Analysis by RegionCompetitive LandscapeMarket CompetitivenessMarket Share Analysis Chapter 3 Specialty Water Treatment Chemicals Technologies and Global Markets Executive SummaryMarket OutlookScope of ReportMarket SummaryMarket OverviewBenefits of Specialty Chemicals in Water TreatmentMarket DynamicsMarket DriverChallengeOpportunityEmerging Technologies and DevelopmentsGreen Chemistry and SustainabilityAdvanced Techniques in Chemical DosingMarket Segmentation AnalysisMarket Analysis by SourceGeographic BreakdownMarket Breakdown by RegionCompetitive IntelligenceIndustry StructureStrategic Analysis Chapter 4 Elastomers Applications and Global Markets Executive SummaryMarket OutlookScope of ReportMarket SummaryMarket OverviewMarket DefinitionImportance of ElastomersMarket DynamicsDriverRestraintOpportunityChallengeEmerging Technologies and DevelopmentsNewest TechnologySupply Chain Analysis of the Global Elastomers MarketsManufacturersSalesMarket Segmentation AnalysisMarket Analysis by ProcessGeographic BreakdownMarket Analysis by RegionCompetitive IntelligenceIndustry StructureCompany Share AnalysisStrategic Analysis Chapter 5 HighPurity Solvents Global Markets Executive SummaryMarket OutlookScope of ReportMarket SummaryMarket OverviewMarket DefinitionSupply Chain AnalysisImportExport AnalysisMarket DynamicsMarket DriverMarket RestraintMarket ChallengeMarket OpportunityRegulatory LandscapeEmerging Technologies and DevelopmentsNew TechnologiesMarket Segmentation AnalysisMarket Analysis by CategoryGeographic BreakdownMarket Analysis by RegionCompetitive IntelligenceIndustry StructureMarket Share AnalysisStrategic AnalysisMergers and Acquisitions Chapter 6 Refrigerants Global Markets Executive SummaryMarket OutlookScope of ReportMarket SummaryMarket OverviewMarket DefinitionClassification of RefrigerantsTypes of RefrigerantsSupply Chain AnalysisMarket DynamicsMarket DriverMarket RestraintMarket ChallengeMarket OpportunityRegulatory LandscapeEmerging Technologies and DevelopmentsNew TechnologiesMarket Segment AnalysisMarket Analysis by TypeGeographic BreakdownMarket Analysis by RegionCompetitive IntelligenceIndustry StructureCompany Share AnalysisStrategic AnalysisExpansions Partnerships and Product Developments Chapter 7 Global HighPurity Quartz Market Executive SummaryMarket OutlookScope of ReportMarket SummaryMarket OverviewMarket DefinitionHighPurity Quartz vs QuartzSupply Chain AnalysisMarket DynamicsMarket DriverMarket RestraintMarket ChallengeMarket OpportunityEmerging Technologies and DevelopmentsNew TechnologiesMarket Segmentation AnalysisMarket Analysis by FormGeographic BreakdownMarket Analysis by RegionCompetitive IntelligenceIndustry StructureMarket Share AnalysisStrategic AnalysisMergers and Acquisitions MampA Chapter 8 Flame Retardant Chemicals Technologies and Global Markets Executive SummaryMarket OutlookScope of ReportMarket SummaryMarket OverviewMarket DefinitionImportance of Flame Retardant ChemicalsTariff War Impact on the Flame Retardant Chemicals MarketMarket DynamicsDriverRestraintOpportunityChallengeEmerging Technologies and DevelopmentsNewest TechnologySupply Chain AnalysisManufacturersSalesMarket Segment AnalysisMarket Analysis by EndUse IndustryGeographic BreakdownMarket Analysis by RegionSouth AmericaCompetitive IntelligenceFlame Retardant Chemicals Markets Company Share AnalysisStrategic Analysis Chapter 9 Acrylic Coatings Technologies End Users and Global Markets Executive SummaryMarket OutlookScope of ReportMarket SummaryMarket OverviewMarket DefinitionImportance of Acrylic CoatingsMarket DynamicsDriverRestraintOpportunityChallengeEmerging Technologies and DevelopmentsNewest TechnologySupply Chain Analysis of Global Acrylic Coatings MarketsManufacturerSalesMarket Segmentation AnalysisMarket Analysis by TypeGeographic BreakdownMarket Analysis by RegionCompetitive IntelligenceAcrylic Coatings Markets Market Share AnalysisStrategic Analysis Chapter 10 Global Engineered Wood Adhesives Market Executive SummaryMarket OutlookScope of ReportMarket SummaryMarket OverviewDefinitionIndustry ScenarioSupply Chain AnalysisMarket DynamicsMarket DriverMarket ChallengeMarket OpportunityEmerging Technologies and DevelopmentsMaterial and Technological TrendsMarket Segment AnalysisMarket Analysis by TechnologyGeographic BreakdownMarket Analysis by RegionCompetitive IntelligenceCompetitive ScenarioMarket Share AnalysisMampA Analysis Chapter 11 Polyester Resin Global Markets Executive SummaryMarket OutlookScope of ReportMarket SummaryMarket OverviewMarket DefinitionSupply Chain AnalysisMarket DynamicsMarket DriverMarket RestraintMarket OpportunityEmerging Technologies and DevelopmentsNew TechnologiesMarket Segmentation AnalysisMarket Analysis by FormGeographic BreakdownMarket Analysis by RegionEuropeAsiaPacificCompetitive IntelligenceIndustry StructureMarket Share AnalysisStrategic AnalysisMerger and Acquisition Analysis Chapter 12 Polymers for Electric Vehicle Global Markets Executive SummaryMarket OutlookScope of ReportMarket SummaryMarket OverviewDefinitionMarket BackgroundSupply Chain AnalysisMarket DynamicsMarket DriverMarket ChallengeMarket OpportunityEmerging Technologies and DevelopmentsKey Technological AdvancesMarket Segment AnalysisMarket Analysis by ApplicationGeographic BreakdownMarket Analysis by RegionCompetitive IntelligenceCompetitive ScenarioMarket Share AnalysisStrategic Analysis Chapter 13 AppendixFor more information about this report visit httpswwwresearchandmarketscomrf7rha9 About ResearchAndMarketscomResearchAndMarketscom is the worlds leading source for international market research reports and market data We provide you with the latest data on international and regional markets key industries the top companies new products and the latest trends CONTACT CONTACT ResearchAndMarketscom Laura WoodSenior Press Manager pressresearchandmarketscom For EST Office Hours Call 19173000470 For US CAN Toll Free Call 18005268630 For GMT Office Hours Call 35314168900
2025 Fuel Cell and Battery Research Review Report with Global Market Forecasts to 2030
Key market opportunities arise in the residential energy storage systems EV battery testing and VehicletoGrid markets driven by advances in technology supportive policies and the push for reduced carbon emissions Innovation in manufacturing and nextgen battery tech also fuels growth across sectorsDublin April 23 2026 GLOBE NEWSWIRE The 2025 Fuel Cell and Battery Research Review report has been added to ResearchAndMarketscoms offeringKey Market Valuations The global market for residential energy storage systems RESS is estimated to grow from 80 billion in 2025 to reach 172 billion by the end of 2030 at a compound annual growth rate CAGR of 164 from 2025 to 2030The global market for electric vehicle EV battery testing is expected to increase from 4 billion in 2025 to reach 94 billion by the end of 2030 at a compound annual growth rate CAGR of 184 from 2025 through 2030The global market for VehicletoGrid V2G is expected to grow from 63 billion in 2025 and is projected to reach 169 billion by the end of 2030 at a compound annual growth rate CAGR of 217 during the forecast period of 2025 to 2030 Report ScopeThe fuel cell industry is experiencing strong demand for clean sustainable energy solutions across sectors Advances in technology supportive government policies and a global push to reduce carbon emissions are the main drivers of industry growth Strong government initiatives such as the US Inflation Reduction Act and Indias National Green Hydrogen Mission are investing billions of dollars in hydrogen and fuel cell projects Manufacturing innovation is boosting scalability and lowering system costs making fuel cell adoption more practical for a wider range of applications Governments are also tightening emissions standards creating additional incentives for adoptionMoreover the battery market is evolving through organic growth regulatory changes and the commercial launch of nextgeneration technologies In the battery market technological developments continue to drive growth Certain examples of such advances include Form Energys ironair systems achieving 100hour duration Energy Vaults gravity storage reaching commercial scale and Highview Powers liquid air systems demonstrating utilityscale viability These innovations address technical challenges fueling the markets growth in the coming yearsKey Topics Covered Chapter 1 Foreword Research Review Scope Chapter 2 Global Market for Hydrogen Pipeline Market OutlookScope of ReportMarket SummaryTechnological Advances and ApplicationsMarket Dynamics and Growth FactorsFuture Trends and DevelopmentsSegmental AnalysisRegional Insights and Emerging MarketsConclusionMarket Overview and Future ScenariosRegulatory Framework for Hydrogen Pipeline IndustryChinaUSMarket DynamicsMarket DriversMarket RestraintsMarket OpportunitiesKey Emerging Technologies for Hydrogen PipelineNew Materials for Hydrogen Storage and TransportationGlobal Hydrogen Pipeline Market by TypeOverviewKey TakeawaysOnshoreOffshoreGlobal Hydrogen Pipeline Market by PressureOverviewKey Takeawayslt 250 BarGreater than 250 BarGlobal Hydrogen Pipeline Market by RegionKey TakeawaysNorth AmericaEuropeAsiaPacificRoW Chapter 3 Residential Energy Storage Blockchain and Energy Sharing Systems Technologies and Global Markets Market OutlookScope of ReportMarket SummaryMarket Dynamics and Growth FactorsFuture Trends and DevelopmentSegmental AnalysisRegional Insights and Emerging MarketsConclusionCurrent Market Overview and Future ScenarioCurrent Market OverviewFuture ScenarioRegulatory Framework and Initiatives by GovernmentsThe European UnionThe USChinaIndiaMarket DynamicsMarket DriversMarket RestraintsChallengesMarket OpportunitiesMarket TrendsKey Emerging TechnologiesIronChromium Redox Flow Batteries RFBsNanotechnologybased Anode and Cathode Materials for SIBsGlobal RESS Market by Battery TypeKey TakeawaysLithiumIon Battery LIBsLeadAcid and Other BatteriesGlobal RESS Market by Connectivity TypeKey TakeawaysOnGridOffGridGlobal RESS Market by RegionSustainability in the RESS Market An ESG PerspectiveIntroduction to ESGEnvironmental ImpactSocial ImpactGovernance ImpactCurrent Status of ESG in the MarketConsumer Attitudes Toward ESG Chapter 4 Global EV Battery Testing Market Market OutlookScope of ReportMarket SummaryMarket Dynamics and Growth FactorsFuture Trends and DevelopmentSegmental AnalysisRegional Insights and Emerging MarketsConclusionCurrent Market Overview and Future ScenarioRegulations and StandardsUN 383IEC 62133IEC 62619IEC 600682CENELEC CLCTC 21XEN 62485GB 380312020 ChinaMarket DynamicsMarket DriversMarket Restraints and ChallengesMarket OpportunitiesCurrent Market TrendsEmerging Technologies in the EV Battery Testing MarketArtificial IntelligenceAdvanced Electrochemical Impedance SpectroscopyXray Computed TomographyGlobal EV Battery Testing Market by TestingKey TakeawaysCell TestingModule TestingPack TestingGlobal EV Battery Testing Market by ServiceKey TakeawaysInhouseOutsourceGlobal EV Battery Testing Market by TypeKey TakeawaysElectricalMechanicalThermalChemicalGlobal EV Battery Testing Market by Battery TypeKey TakeawaysLithiumion BatteryNickelmetal Hydride BatteryLeadacid BatteryGlobal EV Battery Testing Market by RegionSustainability in the EV Battery testing Market An ESG PerspectiveIntroduction to ESGEnvironmental ImpactSocial ImpactGovernance ImpactCurrent Status of ESG in the Global EV Battery Testing MarketConsumer Attitudes Toward ESG in the Global EV Battery Testing Market Chapter 5 Global Quantum Batteries Market Market OutlookScope of ReportMarket SummaryMarket Dynamics and Growth FactorsFuture Trends and DevelopmentsSegmental AnalysisRegional Insights and Emerging MarketsConclusionQuantum Batteries OverviewRegulations and Policies in the Quantum IndustryThe European UnionThe USChinaIndiaMarket DynamicsMarket DriversMarket ChallengesRestraintsMarket OpportunitiesKey Emerging Technologies for Quantum BatteriesArtificial Intelligence AIMachine Learning MLNanotechnologyQuantum Batteries Market by Technology TypeKey TakeawaysQuantum Dot BatteriesQuantum Polymer BatteriesOthersMarket Breakdown by RegionKey TakeawaysNorth AmericaEuropeAsiaPacificRest of the World RoW Chapter 6 VehicletoGrid V2G Global Market Market OutlookScope of ReportMarket SummaryTechnological Advances and ApplicationsMarket Dynamics and Growth FactorsFuture Trends and DevelopmentsSegmental AnalysisRegional Insights and Emerging MarketsConclusionMarket Overview and Future ScenariosMarket DynamicsMarket DriversMarket RestraintsMarket OpportunitiesEmerging TechnologiesApplicationsBidirectional InvertersRole of AI and Machine Learning MLGlobal V2G Market by Vehicle TypeOverviewTakeawaysBEVsPHEVsFCEVsGlobal V2G Market by Charger TypeOverviewDirect Current DCAlternating Current ACMarket Breakdown by RegionOverviewNorth AmericaEuropeAsiaPacificRest of World Chapter 7 NextGeneration Advanced Batteries Global Markets Market OutlookScope of ReportMarket SummaryMarket Dynamics and Growth FactorsFuture Trends and DevelopmentSegmental AnalysisRegional Insights and Emerging MarketsConclusionCurrent Market Overview and Future ScenarioCurrent Market OverviewFuture ScenarioRegulatory Framework and Initiatives by GovernmentsThe European UnionThe USChinaIndiaMarket DynamicsMarket DriversMarket RestraintsChallengesMarket OpportunitiesMarket TrendsKey Emerging TechnologiesNanotechnologybased Anode and Cathode Materials for SIBsAdvanced ElectrolytesMarket Analysis by Battery TypeKey Takeaways for Battery TypeSodiumIon Battery SIBFlow BatterySolidState Battery SSBOthersMarket Analysis by RegionKey Takeaways for RegionNorth AmericaEuropeAsiaPacificRest of the World RoWSustainability in the NextGeneration Advanced Batteries Market An ESG PerspectiveIntroduction to ESGEnvironmental ImpactSocial ImpactGovernance ImpactCurrent Status of ESG in the MarketConsumer Attitudes Toward ESGConcluding Remarks Chapter 8 Global Fuel Cell Generator Market Market OutlookScope of ReportMarket SummaryMarket Dynamics and Growth FactorsSegmental AnalysisRegional Insights and Emerging MarketsConclusionMarket Overview and Future ScenariosRegulatory Framework and Initiatives by GovernmentsUSGermanyUKChinaJapanSouth KoreaMarket DynamicsMarket DriversMarket RestraintsMarket OpportunitiesMarket TrendsEmerging Technologies and ApplicationsNew Developments in Fuel Cell StacksGlobal Fuel Cell Generator Market by TechnologyKey TakeawaysProton Exchange Membrane Fuel CellSolid Oxide Fuel CellOthersGlobal Fuel Cell Generator Market by Stack SizeKey TakeawaysSmall ScaleLarge ScaleMarket Breakdown by RegionKey TakeawaysNorth AmericaAsiaPacificEuropeRest of WorldSustainability in the Fuel Cell Generator Market An ESG PerspectiveOverviewEnvironmental ImpactSocial ImpactGovernance ImpactStatus of ESG in the Global Fuel Cell Generator IndustryConcluding Remarks Chapter 9 Global Fuel Cell Stack Market Market OutlookScope of ReportMarket SummaryMarket Dynamics and Growth FactorsSegmental AnalysisRegional Insights and Emerging MarketsConclusionMarket Overview and Future ScenariosRegulatory Framework and Initiatives by GovernmentsThe USCanadaGermanyThe UKChinaJapanSouth KoreaMarket DynamicsMarket DriversMarket RestraintsMarket OpportunitiesEmerging TechnologiesApplicationsDevelopments in Bipolar PlatesDevelopments in Fuel Cell StacksDevelopment of HighTemperature Proton Exchange Membrane Fuel CellsGlobal Market for Fuel Cell Stacks by TechnologyTakeawaysProton Exchange Membrane Fuel CellsSolid Oxide Fuel CellAlkaline Fuel CellsPhosphoric Acid Fuel CellsOther TechnologiesGlobal Market for Fuel Cell Stacks by RegionNorth AmericaEuropeAsiaPacificRest of WorldSustainability in the Fuel Cell Stack Market An ESG PerspectiveOverviewEnvironmental ImpactSocial ImpactGovernance ImpactStatus of ESG in the Fuel Cell Stack IndustryConcluding Remarks Chapter 10 Global Hydrogen Energy Storage Market Market OutlookScope of ReportMarket SummaryMarket Dynamics and Growth FactorsFuture Trends and DevelopmentsSegmental AnalysisRegional Insights and Emerging MarketsConclusionHydrogen Energy Storage OverviewRegulations and Policies in the IndustryThe Paris AgreementEuropean Green DealEU2021535 LHSS and CHSS Storage SystemsISO 198812018ISO 1261912014EU 792009Market DynamicsMarket DriversMarket Challenges and RestraintsOpportunities in the MarketKey Emerging Technologies for Hydrogen Energy StorageUse of Nanotechnology in Storage TanksHybrid Water ElectrolyzersHydrogen Energy Storage Market by Storage TechnologyKey TakeawaysLiquefactionCompressionMaterialBasedHydrogen Energy Storage Market by RegionKey TakeawaysNorth AmericaEuropeAsiaPacificRest of the World RoW Chapter 11 Global Lithiumion Battery Market Market OutlookScope of ReportMarket SummaryMarket Dynamics and Growth FactorsFuture Trends and DevelopmentSegmental AnalysisRegional Insights and Emerging MarketsConclusionCurrent Market Overview and Future ScenarioCurrent ScenarioFuture ScenarioRegulatory Framework and Initiatives by GovernmentsThe European UnionThe USChinaIndiaMarket DynamicsMarket DriversMarket RestraintsChallengesMarket OpportunitiesKey Emerging Technologies for Lithiumion BatteryRole of Artificial Intelligence and Machine Learning in Lithiumion BatteryRole of Nanotechnology in Lithiumion BatteryThermal Management Systems TMSGlobal Lithiumion Battery Market by Battery TypeKey Takeaways for Battery TypeLithium Nickel Manganese CobaltLithium Iron PhosphateLithium Nickle Cobalt Aluminum OxideOthersGlobal Lithiumion Battery Market by ComponentKey Takeaways for ComponentCathodeAnodesElectrolytesSeparatorsOthersMarket Breakdown by RegionKey Takeaways for RegionNorth AmericaEuropeAsiaPacificRest of the WorldSustainability in the LIB Market An ESG PerspectiveOverviewEnvironmental ImpactSocial ImpactGovernance ImpactCurrent Status of ESG in the MarketConsumer Attitudes Towards ESG in the Global LIB MarketConcluding Remarks Chapter 12 Global EV Battery Swapping Market Market OutlookScope of ReportMarket SummaryMarket Dynamics and Growth FactorsFuture Trends and DevelopmentsSegmental AnalysisRegional Insights and Emerging MarketsConclusionCurrent Market Overview and Future ScenarioCurrent ScenarioFuture ScenarioRegulatory Framework and Initiatives by GovernmentsThe European UnionUSChinaIndiaTaiwanMarket DynamicsMarket DriversMarket RestraintsMarket OpportunitiesKey Emerging Technologies for EV Battery SwappingRole of Artificial Intelligence and Machine Learning in EV Battery SwappingRole of Nanotechnology in EV Battery SwappingRole of Advanced Robotics in EV Battery SwappingGlobal EV Battery Swapping Market by Battery TypeKey TakeawaysLithiumionLeadacidNickel Metal HydrideGlobal EV Battery Swapping Market by Station TypeKey TakeawaysManual StationsAutomatic Stations Chapter 13 AppendixFor more information about this report visit httpswwwresearchandmarketscomrw6datx About ResearchAndMarketscomResearchAndMarketscom is the worlds leading source for international market research reports and market data We provide you with the latest data on international and regional markets key industries the top companies new products and the latest trends CONTACT CONTACT ResearchAndMarketscom Laura WoodSenior Press Manager pressresearchandmarketscom For EST Office Hours Call 19173000470 For US CAN Toll Free Call 18005268630 For GMT Office Hours Call 35314168900
2025 Automotive Technology Research Review Report with Global Market Forecasts to 2030
The market opportunities include enhanced demand for automotive cybersecurity to safeguard connected vehicles increased need for battery management systems in EVs for efficiency growing interest in NEVs for ecofriendly urban transport and expanding hydrogen truck adoption for sustainable freight solutionsDublin April 23 2026 GLOBE NEWSWIRE The 2025 Automotive Technology Research Review report has been added to ResearchAndMarketscoms offeringKey Market Valuations The global market for automotive cybersecurity was valued at 34 billion in 2024 and is projected to reach 82 billion by the end of 2030 at a compound annual growth rate CAGR of 161 from 2025 to 2030The global market for automotive battery management system was valued at 56 billion in 2024 and it is projected to reach 139 billion by the end of 2030 at a compound annual growth rate CAGR of 168 from 2025 to 2030The global market for neighborhood electric vehicles NEVs was valued at 4 billion in 2024 and projected to reach 74 billion by the end of 2030 at a compound annual growth rate CAGR of 114 from 2025 to 2030 Report ScopeThe global automotive industry is experiencing transformation driven by the adoption of technologies such as artificial intelligence AI machine learning ML the Internet of Things IoT and nextgeneration connectivity These technologies are reshaping the automotive value chain impacting vehicle design manufacturing processes safety systems and overall sustainability initiatives With the increase in connected and autonomous vehicles automotive cybersecurity has become critical requiring comprehensive security frameworks and realtime threat detection systems Manufacturers are investing in cybersecurity solutions to protect vehicles against evolving threats and ensure safe reliable operations The growing adoption of electric vehicles is accelerating demand for advanced battery management systems that improve efficiency and extend battery life These systems help optimize energy usage enhance performance and ensure reliability in modern electric and hybrid vehicle platformsAutomotive sensor technologies play a vital role in enabling autonomous driving advanced driver assistance systems ADAS and continuous vehicle monitoring These sensors support realtime data collection and analysis improving vehicle safety navigation accuracy and overall driving experience The global neighborhood electric vehicles market is gaining traction as urban areas seek affordable and environmentally friendly transportation alternatives he hydrogen truck market is expanding rapidly as industries adopt zeroemission solutions for heavyduty and longhaul transportation Hydrogenpowered trucks offer advantages including faster refueling times longer driving range and higher payload capacity These capabilities position hydrogen trucks as a promising solution for sustainable efficient freight transportation in the futureKey Topics Covered Chapter 1 Foreword Research Review Scope Chapter 2 Automotive Cybersecurity Global Markets Market OutlookScope of ReportMarket SummaryMarket Dynamics and Growth FactorsFuture Trends and DevelopmentsSegmental AnalysisRegional Insights and Emerging MarketsConclusionMarket OverviewRegulations and StandardsMarket DynamicsMarket DriversMarket RestraintsChallengesMarket OpportunitiesEmerging Technologies and DevelopmentSecure OTA UpdateIntrusion Detection and Prevention Systems IDPSGlobal Market for Automotive Cybersecurity By OfferingKey TakeawaysHardwareSoftwareServicesGlobal Market for Automotive Cybersecurity by Vehicle TypeTakeawaysPassenger VehiclesCommercial VehiclesGlobal Market for Automotive Cybersecurity by Propulsion TypeTakeawaysInternal Combustion EnginesEVsGlobal Market for Automotive Cybersecurity by RegionTakeawaysNorth AmericaEuropeAsiaPacificRest of the WorldSustainability in the Automotive Cybersecurity Market ESG PerspectiveEnvironmental ImpactSocial ImpactGovernance ImpactStatus of ESG in the Automotive Cybersecurity MarketConsumer Attitudes Towards ESGCase Studies Examples of Successful Implementation of ESGConcluding Remarks Chapter 3 Automotive Battery Management System Global Markets Market OutlookScope of ReportMarket SummaryMarket Dynamics and Growth FactorsFuture Trends and DevelopmentsSegmental AnalysisRegional Insights and Emerging MarketsConclusionMarket OverviewAnalysis of Macroeconomic FactorsRegulations and StandardsCase StudiesMarket DynamicsMarket DriversRestraintsChallengesOpportunitiesCurrent Market TrendsEmerging Technologies and DevelopmentsMultimodel CoestimationCloudbased BMSGlobal Automotive BMS Market by OfferingTakeawaysHardwareSoftwareServicesGlobal Automotive BMS Market by ArchitectureTakeawaysWiredWirelessGlobal Automotive BMS Market by Battery TypeTakeawaysLithiumion BatteriesNiMH BatteriesLeadacid BatteriesGlobal Automotive BMS Market by RegionTakeawaysNorth AmericaEuropeAsiaPacificRest of the WorldSustainability in the Global Automotive BMS Market ESG PerspectiveEnvironmental ImpactSocial ImpactGovernance ImpactStatus of ESG in the Automotive BMS IndustryConsumer Attitudes Towards ESGSuccessful Implementations of ESGConcluding Remarks Chapter 4 Global Markets for Automotive Sensor Technologies Market OutlookScope of ReportMarket SummaryMarket Dynamics and DriversTrends and Future DevelopmentsAnalysis by SegmentRegional and Emerging MarketsConclusionMarket OverviewAutonomous VehiclesRegulatory LandscapeCase StudiesMarket DynamicsMarket DriversMarket RestraintsCurrent TrendsFuture Market OpportunitiesEmerging Technologies and DevelopmentsSolidState LiDAR TechnologyNanotechnology in Sensor MaterialsAutomotive Sensor Technologies Market by Vehicle TypeKey TakeawaysPassenger CarsCommercial VehiclesAutomotive Sensor Technologies Market by Propulsion TechnologyKey TakeawaysICE VehiclesAlternative Fuel VehiclesAutomotive Sensor Technologies Market by RegionKey TakeawaysNorth AmericaEuropeAsiaPacificRest of the WorldSustainability in the Automotive Sensor Industry ESG PerspectiveEnvironmental ImpactPerformanceSocial ImpactPerformanceGovernance ImpactPerformanceESG Risk Ratings in the Automotive Sensor Technologies MarketCase StudiesConcluding Remarks Chapter 5 Global Neighborhood Electric Vehicles Market Market OutlookScope of the ReportMarket SummaryMarket Dynamics and Growth FactorsFuture Trends and DevelopmentsSegmental AnalysisRegional Insights and Emerging MarketsConclusionMarket OverviewMacroeconomic FactorsRegulatory Frameworks and Government InitiativesMarket DynamicsMarket DriversMarket ChallengesRestraintsMarket OpportunitiesEmerging Technologies and DevelopmentsAutonomous Charging3D EV PrintingV2G EV Charging StationsGlobal NEV Market by Battery TypeKey TakeawaysLIBsLABsGlobal NEV Market by RegionKey TakeawaysNorth AmericaEuropeAsiaPacificRest of the World RoW Chapter 6 Global Market for Hydrogen Trucks Market OutlookScope of ReportMarket SummaryTechnological Advances and ApplicationsMarket Dynamics and Growth FactorsFuture Trends and DevelopmentsSegmental AnalysisRegional Insights and Emerging MarketsConclusionMarket OverviewRegulatory Framework and Government InitiativesMarket DynamicsMarket DriversMarket RestraintsMarket OpportunitiesEmerging Technologies and DevelopmentsTechnological Developments in Hydrogen ProductionIncorporating AIGlobal Hydrogen Truck Market by ProductTakeawaysHeavyDuty TrucksMediumDuty TrucksSmallDuty TrucksGlobal Hydrogen Truck Market by Fuel Cell TechnologyTakeawaysPEMFCSolid Oxide Fuel Cell SOFCGlobal Hydrogen Truck Market by RegionTakeawaysNorth AmericaEuropeAsiaPacificRest of World Chapter 7 AppendixFor more information about this report visit httpswwwresearchandmarketscomrul0wxq About ResearchAndMarketscomResearchAndMarketscom is the worlds leading source for international market research reports and market data We provide you with the latest data on international and regional markets key industries the top companies new products and the latest trends CONTACT CONTACT ResearchAndMarketscom Laura WoodSenior Press Manager pressresearchandmarketscom For EST Office Hours Call 19173000470 For US CAN Toll Free Call 18005268630 For GMT Office Hours Call 35314168900
2025 Semiconductor Manufacturing Research Review
Key market opportunities lie in the expansion of semiconductor and thermal management technologies driven by demand for AI ML IoT and EVs Advances in chip designs and localized supply chains present further opportunities with significant growth anticipated in AIcentric applications across various industriesDublin April 23 2026 GLOBE NEWSWIRE The 2025 Semiconductor Manufacturing Research Review report has been added to ResearchAndMarketscoms offeringThe semiconductor industry as the backbone of modern infrastructure is expanding worldwide driven by increased demand for highperformance computing solutions and AIenabled applications This surge is supported by the growing demand for advanced networking and computeintensive solutions including Artificial Intelligence AI Machine Learning ML and Internet of Things IoT Advances in chip design including the development of smaller node sizes such as 2nm and 3nm are offering new opportunities for nextgeneration computing and highperformance applications As organizations shift toward AIcentric solutions the demand for semiconductor chips dedicated to AI and ML applications is increasing across industries including healthcare automotive retail and financial services as they offer highperformance computing and faster data processingRising geopolitical tensions are increasing the need for resilient localized supply chains and are driving investments in domestic semiconductor manufacturing The growing demand for electric vehicles EVs 5G networks advanced driverassistance systems ADAS and AI chipsets is creating significant business opportunities for semiconductor manufacturers and foundriesKey Topics Covered Chapter 1 Foreword Research Review Scope Chapter 2 The Global Market for Thermal Management Technologies Market OutlookScope of ReportMarket SummaryMarket Dynamics and Growth FactorsEmerging TechnologiesSegmental AnalysisRegional AnalysisConclusionMarket OverviewFuture OutlookMarket DynamicsMarket DriversMarket RestraintsMarket OpportunitiesRegulatory LandscapeRegulatory Scenario of TM SystemsEmerging TechnologiesNanostructured MaterialsSmart Fibers and TextilesGlobal Thermal Management Technologies Market by DeviceKey TakeawaysConvection Cooling DevicesConduction Cooling DevicesHybrid Cooling DevicesAdvanced Cooling DevicesGlobal Thermal Management Technologies Market by RegionKey TakeawaysNorth AmericaEuropeAsiaPacificRest of the WorldEnvironmental Social and Governance ESG PerspectiveKey TakeawaysEnvironmental ImpactSocial ImpactGovernance ImpactCurrent Status of ESG in the TM Technologies MarketConcluding Remarks Chapter 3 Thermal Interface Materials Technologies Applications and Global Markets Market OutlookScope of ReportMarket SummaryMarket Dynamics and Growth FactorsEmerging TechnologiesSegmental AnalysisRegional AnalysisConclusionMarket OverviewFuture OutlookMarket DynamicsMarket DriversMarket RestraintsMarket OpportunitiesRegulatory LandscapeRegulatory ScenarioEmerging TechnologiesGrapheneBased TIMsGlobal Thermal Interface Materials Market by Material TypeKey TakeawaysPolymer CompositesMetalsPhaseChange MaterialsGlobal Thermal Interface Materials Markets by RegionKey TakeawaysNorth AmericaEuropeAsiaPacificRest of the WorldEnvironmental Social and Governance PerspectiveKey TakeawaysOverviewEnvironmental ImpactSocial ImpactGovernance ImpactStatus of ESG in the TIMs MarketConcluding Remarks Chapter 4 Global Markets for RolltoRoll Technologies for Flexible Devices Market OutlookScope of ReportMarket SummaryTechnological Advances and ApplicationsMarket Dynamics and Growth FactorsFuture Trends and DevelopmentsSegmental AnalysisRegional Insights and Emerging MarketsConclusionMarket and Technology OverviewR2R Versus Batch ProcessesFuture OutlookMarket DynamicsMarket DriversMarket RestraintsMarket OpportunitiesEmerging Technologies and DevelopmentsOrganic ElectronicsGlobal R2R Technologies for Flexible Devices Market by Process CategoryKey TakeawaysSubtractive MethodAdditive MethodGlobal R2R Technologies for Flexible Devices Market by Deposition MethodKey TakeawaysThick FilmThin FilmGlobal R2R Technologies for Flexible Devices Market by RegionKey TakeawaysNorth AmericaEuropeAsiaPacificRest of the WorldSustainability in the R2R Technologies for Flexible Devices Industry An ESG PerspectiveOverviewKey ESG Issues in the R2R Technologies in the Flexible Devices IndustryESG Performance AnalysisCurrent Status of ESG in the Global Market Chapter 5 Global Semiconductor Silicon Wafer Market Market OutlookScope of ReportMarket SummaryMarket Dynamics and Growth FactorsEmerging TechnologiesSegmental AnalysisRegional AnalysisConclusionMarket OverviewFuture OutlookMarket DynamicsMarket DriversMarket RestraintsMarket OpportunitiesRegulatory LandscapeRegulatory Scenario for Semiconductor Silicon WafersEmerging TechnologiesNextGeneration AI and HPC ChipsGlobal Semiconductor Silicon Wafer Market by Wafer SizeKey Takeaways300 mm200mm100mmOthersGlobal Semiconductor Silicon Wafer Market by RegionKey TakeawaysNorth AmericaEuropeAsiaPacificRest of the WorldEnvironmental Social and Governance PerspectiveKey TakeawaysEnvironmental ImpactSocial ImpactGovernance ImpactStatus of ESG in the Semiconductor Silicon Wafer MarketConcluding Remarks Chapter 6 Semiconductor Devices for HighTemperature Applications Market Opportunities Market OutlookScope of ReportMarket SummaryMarket Dynamics and Growth FactorsEmerging TechnologiesSegmental AnalysisRegional Insights and Emerging MarketsConclusionMarket OverviewMarket DynamicsMarket DriversMarket RestraintsMarket OpportunitiesEmerging Trends and TechnologiesPackaging Innovations Enabling Reliable HighTemperature Semiconductor OperationGlobal Semiconductor Devices for HighTemperature Applications Market by MaterialsKey TakeawaysSiliconIIIV materialsGlobal Semiconductor Devices for HighTemperature Applications Market by Operating TemperatureKey Takeaways126C to 250CHigher than 250CGlobal Semiconductor Devices for HighTemperature Applications Market by RegionKey TakeawaysNorth AmericaEuropeAsiaPacificRest of the WorldSustainability in the Semiconductor Devices for High Temperature Applications Industry An ESG PerspectiveKey TakeawaysKey ESG Issues in the Semiconductor Devices for HighTemperature Applications MarketESG Performance AnalysisCurrent Status of ESG in the Semiconductor Devices for HighTemperature Applications MarketConcluding Remarks Chapter 7 Gallium Nitride GaN Powered Chargers Global Markets Market OutlookScope of ReportMarket SummaryMarket Dynamics and Growth FactorsEmerging TechnologiesSegmental AnalysisRegional Insights and Emerging MarketsConclusionMarket OverviewFuture ExpectationsMarket DynamicsMarket DriversMarket RestraintsMarket OpportunitiesEmerging Trends and TechnologiesMultiChannel NTC Sensor Technology with RealTime Thermal MonitoringGlobal Gallium Nitride GaN Powered Chargers Market by Device TypeKey TakeawaysSmartphones and TabletsLaptopsMultidevicesOthersGlobal Gallium Nitride GaN Powered Chargers Market by RegionKey TakeawaysNorth AmericaEuropeAsiaPacificRest of the WorldSustainability in the GaNPowered Chargers Industry ESG PerspectiveKey ESG Issues in the GaNPowered Chargers MarketESG Performance AnalysisCurrent Status of ESG in the GaNPowered Chargers MarketConcluding Remarks Chapter 8 Semiconductor Chips Applications and Impact of Shortage Market OutlookScope of ReportMarket SummaryMarket Dynamics and Growth FactorsEmerging TechnologiesSegmental AnalysisRegional AnalysisConclusionCurrent Market OverviewFuture OutlookMarket DynamicsMarket DriversMarket RestraintsMarket OpportunitiesEmerging Technologies3D Chip Stacking 3D ICsGlobal Semiconductor Chip Market by TypeKey TakeawaysLogic ICsMemory ChipsAnalog ICsMicroprocessorsSensorsOther TypesGlobal Semiconductor Chips Market by RegionKey TakeawaysNorth AmericaEuropeAsiaPacificLatin AmericaMiddle East and AfricaEnvironmental Social and Governance ESG PerspectiveESG Performance in the Semiconductor Chip IndustryStatus of ESG in the Semiconductor Chip IndustryConcluding Remarks Chapter 9 ChiponBoard LED Global Markets Market OutlookScope of ReportMarket SummaryMarket Dynamics and Growth FactorsEmerging TechnologiesSegment AnalysisRegional AnalysisConclusionCurrent Market OverviewFuture OutlookMarket DynamicsMarket DriversMarket RestraintsMarket OpportunitiesRegulatory LandscapeOverviewRegulatory Scenario of ChiponBoard LEDsEmerging TechnologiesFlipChip COB DesignsGlobal ChiponBoard LED Market by Product TypeKey TakeawaysCOB LED ModulesCOB LED ArraysCOB LED ComponentsGlobal ChiponBoard LED Market by RegionKey TakeawaysNorth AmericaEuropeAsiaPacificRest of the World Chapter 10 Global Digital Isolators Market Market OutlookScope of ReportMarket SummaryMarket Dynamics and Growth FactorsEmerging TechnologiesSegmental AnalysisRegional Insights and Emerging MarketsConclusionCurrent Market OverviewFuture ExpectationsMarket DynamicsMarket DriversMarket RestraintsMarket OpportunitiesRegulatory LandscapeOverviewEmerging TechnologiesAutomotivedriven InnovationGlobal Digital Isolators Market by TechnologyKey TakeawaysCapacitiveMagneticGMRGlobal Digital Isolators Market by Data SpeedKey Takeaways11 to 100 Mbps101 to 150 MbpsUp to 10 MbpsAbove 150 MbpsGlobal Digital Isolators Market by RegionKey TakeawaysNorth AmericaEuropeAsiaPacificRest of the WorldSustainability in the Digital Isolators Industry ESG PerspectiveESG Performance in the Semiconductor Chip IndustryStatus of ESG in the Semiconductor Chip IndustryConcluding Remarks Chapter 11 Appendix For more information about this report visit httpswwwresearchandmarketscomrafqblo About ResearchAndMarketscomResearchAndMarketscom is the worlds leading source for international market research reports and market data We provide you with the latest data on international and regional markets key industries the top companies new products and the latest trends CONTACT CONTACT ResearchAndMarketscom Laura WoodSenior Press Manager pressresearchandmarketscom For EST Office Hours Call 19173000470 For US CAN Toll Free Call 18005268630 For GMT Office Hours Call 35314168900

Stanislaus County Deploys Ten Beam Global EV ARC™ Systems to Support County Fleet Electrification
SAN DIEGO April 21 2026 GLOBE NEWSWIRE Beam Global NasdaqBEEM a leading provider of innovative and sustainable infrastructure solutions for transportation energy security and smart city infrastructure today announced the deployment of ten EV ARC offgrid solarpowered electric vehicle EV charging systems and an ARC Mobility trailer for Stanislaus County California The systems will be deployed to support charging for the Countys EV fleetThe EV ARC systems provide rapidly deployable EV charging infrastructure without the need for construction trenching or utility grid connection Each unit generates and stores its own electricity delivering reliable renewable energy for fleet operations while reducing emissions and protecting against grid outages The ARC Mobility trailer further enhances flexibility by enabling Stanislaus County to move the EV ARC systems quickly and efficiently in the event their charging needs change or there is an emergency situation such as an earthquake or a wild fire which requires rapidly deployed energy infrastructure in a new locationThe systems were purchased using Congestion Mitigation and Air Quality CMAQ Program funds administered by the Federal Highway Administration FHWA Stanislaus County utilized Beam Globals Sourcewell cooperative purchasing contract to streamline procurementWe applaud Stanislaus County for choosing to Drive on Sunshine while providing robust sustainable and affordable clean energy for their fleet vehicles said Desmond Wheatley CEO of Beam Global State and county governments continue to electrify their fleets saving money on gasoline and diesel at a time where oil cost volatility is being reflected at the gas pump Beam Globals renewably energized EV charging infrastructure solutions provide electricity for charging EVs at zero unit cost for the energy ensuring that whatever happens at the pump or to utility rates our customers will never pay more to charge their fleet vehiclesBy deploying EV ARC systems and the ARC Mobility trailer Stanislaus County will be able to charge its fleet vehicles using clean renewable energy generated onsite improving operational efficiency while avoiding utility costs construction delays and grid dependency associated with traditional EV charging infrastructureFor more information about Beam Globals sustainable EV charging solutions visit BeamForAllcom or contact BeamTeamBeamForAllcomAbout Beam GlobalBeam Global is a sustainable technology innovator which develops and manufactures infrastructure products and technologies We operate at the nexus of innovative and reliable energy transportation and smart cities solutions with a focus on sustainable energy infrastructure rapidly deployed and scalable EV charging solutions safe energy storage energy security and intelligent Infrastructure With operations in the US Europe and the Middle East Beam Global develops patents designs engineers and manufactures unique and advanced innovative technology solutions that power transportation provide secure sources of electricity enable Smart City services save time and money and protect the environment Beam Global is headquartered in San Diego CA with facilities in Broadview IL Belgrade and Kraljevo Serbia and Abu Dhabi UAE Beam Global is listed on Nasdaq under the symbol BEEM For more information visit BeamForAllcomLinkedInYouTube InstagramandX ForwardLooking StatementsThis Beam Global Press Release may contain forwardlooking statements All statements in this Press Release other than statements of historical facts are forwardlooking statements Forwardlooking statements are generally accompanied by terms or phrases such as estimate project predict believe expect anticipate target plan intend seek goal will should may or other words and similar expressions that convey the uncertainty of future events or results These statements relate to future events or future results of operations These statements are only predictions and involve known and unknown risks uncertainties and other factors which may cause Beam Globals actual results to be materially different from these forwardlooking statements Except to the extent required by law Beam Global expressly disclaims any obligation to update any forwardlooking statements Investor Relations Luke Higgins1 8582617646IRBeamForAllcom Media ContactLisa Potok1 8583279123PressBeamForAllcom

Umbrella Lab Announces RUO Documentation And Traceability Update For MSCs Exosomes
TUCSON Ariz April 11 2026 GLOBE NEWSWIRE Umbrella Labs today issued a company announcement confirming an internal documentation and traceability update for its MSCs exosomes category provided strictly for laboratory developmental research use only This update is part of an ongoing standardization initiative focused on identityfield consistency record continuity and reproducibility support for laboratories that rely on extracellular vesicle inputs across multirun bench workflows Effective immediately the MSCs exosomes update aligns internal records and outwardfacing reference language under a single consistent documentation framework designed to reduce ambiguity in receiving logs internal procurement paperwork and study documentation This announcement is limited to operational and documentation changes intended to support reproducibility and clean recordkeeping and it does not introduce clinical therapeutic diagnostic or humanuse positioning Umbrella Labs is issuing this update in response to evolving press release acceptance requirements that prioritize company announcements and operational updates particularly where researchonly materials can be misclassified as healthrelated content The purpose of this release is to document a specific company change in how MSCderived exosome reference materials are named recorded and traced for research procurement and laboratory documentation with a clear emphasis on traceability internal controls and researchonly scope As part of the update Umbrella Labs consolidated the authoritative identity fields materialformat notes and traceability language for the MSCs exosomes category into one stable reference record intended to be used consistently across documentation workflows Laboratories purchasing for research can cite the MSCs exosomes reference record maintained at httpsumbrellalabsisshopnewreleasescategorymscsexosome when aligning internal naming strings inventory entries and study records to a single source of truth for identity and handling statements This consolidation is intended to reduce record fragmentation when protocols are transferred between operators or repeated after delays and it helps preserve comparability across runs by anchoring documentation to a consistent reference This announcement does not change the researchonly scope of these materials and does not introduce any nonresearch claims or positioning What changed in this update Umbrella Labs implemented documentation and process controls intended to improve clarity and reduce record fragmentation in laboratory workflows that use MSCderived extracellular vesicle inputs as recurring reference materials These changes focus on how the materials are referenced and traced rather than on scientific claims or outcomes 1 Standardized naming and synonym controlUmbrella Labs standardized the primary naming convention for the category as MSCs exosomes and aligned common variants such as MSCderived exosomes MSC extracellular vesicles MSCEVs and similar shorthand under a single preferred structure for documentation This reduces the likelihood that the same material family is recorded under multiple names across different systems which can complicate inventory reconciliation and study replication 2 Unified identityfield presentationUmbrella Labs aligned the presentation order and terminology used for identity fields to match a consistent format across documentation For extracellular vesicles labs often record a wider set of context fields than with small molecules including source description language lot identifiers storage conditions concentration or particle metrics where applicable and container format notes This update supports consistent entry into notebooks LIMS and internal QA records by keeping identityfield language stable and predictable 3 Traceability language alignmentUmbrella Labs standardized the traceability wording used across internal records so that lot identifiers receiving logs and associated documentation pointers remain consistent This reduces ambiguity during internal review and improves continuity when a laboratory needs to confirm exactly which reference input was used for a given experimental run 4 Handlingnote normalization for documentation purposesUmbrella Labs clarified baseline format notes and handlinglanguage statements used in documentation so the same nonprescriptive handling assumptions appear consistently across records This does not replace a laboratorys institutional SOPs but it provides a stable reference statement set that helps reduce drift in how preparation assumptions are written and interpreted across teams Why this announcement is being issued now Umbrella Labs is issuing the MSCs exosomes documentation and traceability update as part of a broader standardization initiative addressing a common cause of irreproducibility in extracellular vesicle research documentation drift and record fragmentation In multirun programs results can become difficult to compare when a materials naming string reference fields or baseline handling notes vary across notebooks inventory systems method sheets and analytical reports Even small mismatches can fragment records and create avoidable uncertainty during replication or troubleshooting This update is also being issued because researchonly material announcements are increasingly evaluated by press distribution channels as company updates rather than as health content Umbrella Labs is therefore focusing this release on a specific operational change a defined documentation consolidation and traceability alignment rather than on biological narratives or outcome claims The intent is to provide a clear announcement that a process and recordkeeping framework has been updated with an explicit researchonly scope Researchonly context for MSCs exosomes in laboratory workflows MSCderived exosome preparations are commonly used in laboratory settings as extracellular vesicle reference inputs in controlled experimental systems Depending on the platform laboratories may use such inputs in analytical characterization workflows vesicle biology method development assay compatibility checks and controlled exposure experiments designed to evaluate cellular uptake vesicleassociated cargo signatures or signalingproxy marker programs in vitro These use cases rely on tight control of input identity preparation timing and recordkeeping so results remain comparable across runs Extracellular vesicle research can be sensitive to variability introduced by collection and processing differences storage temperature history thaw cycles and differences in how concentration is represented In practice two labs can appear to use the same exosome input while actually using different lots different storage histories or different normalization schemes which can change measured outcomes Umbrella Labs is addressing that risk by standardizing how reference fields are recorded and by providing a single documentation anchor that laboratories can cite consistently This announcement is intentionally limited to research workflow considerations that affect documentation and traceability Umbrella Labs is not issuing scientific outcome claims in this release and it is not describing clinical or therapeutic usage The purpose is to document the operational change that supports consistent research procurement records and reproducible documentation practices How documentation improvements support reproducibility in extracellular vesicle studies In laboratory developmental research reproducibility depends on holding constant the variables that should not change while intentionally varying the variables under study Documentation is the mechanism that enforces this discipline When documentation is inconsistent two runs that appear identical may actually differ in a subtle but important way such as the lot identifier the reported normalization basis the number of thaw events or the assumed handling baseline recorded in the protocol The MSCs exosomes update is intended to reduce four common points of failure that routinely appear in multirun vesicle work First mismatched naming across systems Extracellular vesicle inputs are frequently referenced by informal shorthand that differs between teams and instruments If a material is entered under one shorthand in an inventory system and another shorthand in a protocol records fragment and downstream analysis becomes harder Standardized naming reduces this fragmentation Second inconsistent identityfield entry EV workflows often include multiple descriptors such as lot identifier format notes storage temperature concentration representation and handling timeline When these fields appear in different formats or different orders transcription errors become more likely and reconciliation becomes slower Unified identityfield presentation reduces these errors Third weak traceability when troubleshooting If outcomes differ between runs the first diagnostic step is to confirm whether the same reference input was used and whether the same baseline assumptions were applied Traceability alignment makes this confirmation simpler Fourth drift in baseline handling language EV work is sensitive to thaw timing mixing and staging Even when a lab follows the same SOP the way steps are described in documentation can drift across operators Stable handlingnote language reduces interpretive drift and supports cleaner method transfer Standardization actions included in the MSCs exosomes update Umbrella Labs implemented a set of standardization actions to align MSCderived exosome reference materials with a broader companywide documentation framework Single referencerecord anchoringUmbrella Labs consolidated categorylevel identity and baseline format notes into one authoritative reference record to reduce ambiguity and duplicate entries across documents This supports labs that need one stable reference point to cite in internal paperwork and study documentation Internal record mapping between lot identifiers and documentation pointersUmbrella Labs reinforced internal mapping so that lot identifiers connect cleanly to associated documentation files helping prevent situations where a lot is referenced without a clear corresponding documentation trail Consistent terminology for researchonly scope languageUmbrella Labs standardized how researchonly scope statements appear across records so that the same nonclinical language is used consistently This supports labs that require consistent scope statements in internal compliance documents and method sheets Formatnote consistency for documentationUmbrella Labs clarified and standardized how format notes are expressed so laboratories can reference the same baseline assumptions consistently when writing protocols study plans and internal reports This includes stable phrasing for storage expectations and handling considerations that commonly influence vesicle integrity and comparability Recommended documentation practices for laboratories purchasing for research Umbrella Labs is including this section because the practical value of a documentation update depends on how consistently it is used The following recommended practices improve comparability across multirun studies These are not laboratory protocols and do not replace institutional SOPs but they reflect common recordkeeping discipline used in reproducibilityforward research environments Record the standardized material name and reference anchorUse one naming convention consistently across notebooks inventory systems method sheets and analytical outputs Anchor internal records to a single supplier reference record so the same identity fields are used across documents Record the lot identifier receiving date and storage locationEnsure each run can be traced to a specific lot reference and receiving event This helps isolate whether differences are modeldriven or inputdriven when troubleshooting Record handling timeline and thawhistory notes when applicableEV inputs can be sensitive to thaw cycles and staging time Record the date and time of thaw the time between thaw and experimental use and whether the workflow includes intermediate staging steps governed by an institutional SOP Timing differences can confound uptake readouts and marker programs Record the normalization basis used in the protocolWhen an EV input is used labs often normalize by volume by particlecount proxy by protein proxy or by another internal normalization method Record the chosen basis explicitly This preserves interpretability when comparing runs and when transferring protocols between teams Record container and assayenvironment context when relevantExtracellular vesicles can interact with surfaces and media components When the assay architecture is sensitive record the container types used for intermediate steps and the assay environment context that could influence effective exposure The goal is to preserve the minimum information needed to replicate conditions not to overdocument Record deviations as deviations rather than rewriting assumptionsWhen a deviation occurs record it explicitly rather than adjusting baseline assumptions silently This preserves the integrity of the documentation chain and improves interpretability during later review How this update fits into Umbrella Labs broader announcement program Umbrella Labs is continuing a wider documentation standardization initiative aimed at improving traceability and reducing ambiguity in researchonly procurement records Laboratory research programs are increasingly timeresolved and multilayered combining vesicle characterization workflows marker panels and broader profiling methods within a single project These projects are more vulnerable to documentation drift because a small inconsistency in the input identity chain can propagate across multiple measurement layers and create avoidable uncertainty The MSCs exosomes update reflects the same approach applied to other frequently referenced materials a stable reference anchor consistent identity fields traceability alignment and standardized researchonly scope language Umbrella Labs will continue to apply these controls where appropriate with the objective of improving documentation clarity and record continuity for research procurement and multirun bench workflows Research use only statement MSCs exosome category materials supplied by Umbrella Labs are provided strictly for laboratory developmental research use only They are not intended for clinical diagnostic therapeutic medical veterinary or household applications and terms of sale apply Materials should be handled only by qualified personnel in appropriate research facilities using established institutional procedures for biochemical reagents documentation and safety About Umbrella Labs Umbrella Labs is a USbased supplier of researchgrade biochemical materials focused on supporting laboratory developmental research use only applications in academic and private laboratory settings The company emphasizes documentation clarity traceable identity fields and reproducibilityaligned handling guidance so research teams can maintain consistent inputs across repeated experiments and multirun bench workflows Media and Procurement Contact Umbrella Labs3280 E Hemisphere LoopTucson AZ 85706supportumbrellalabsus 18662897276 Disclaimer This content is provided by Umbrella Labs The statements views and opinions expressed in this column are solely those of the content provider This media platform provides the content of this article on an asis basis without any warranties or representations of any kind express or implied We do not assume any responsibility or liability for the accuracy content images videos licenses completeness legality or reliability of the information presented herein Any concerns complaints or copyright issues related to this article should be directed to the content provider mentioned above A photo accompanying this announcement is available at httpswwwglobenewswirecomNewsRoomAttachmentNg2ca9d80f8e574b54807b155a6a724471
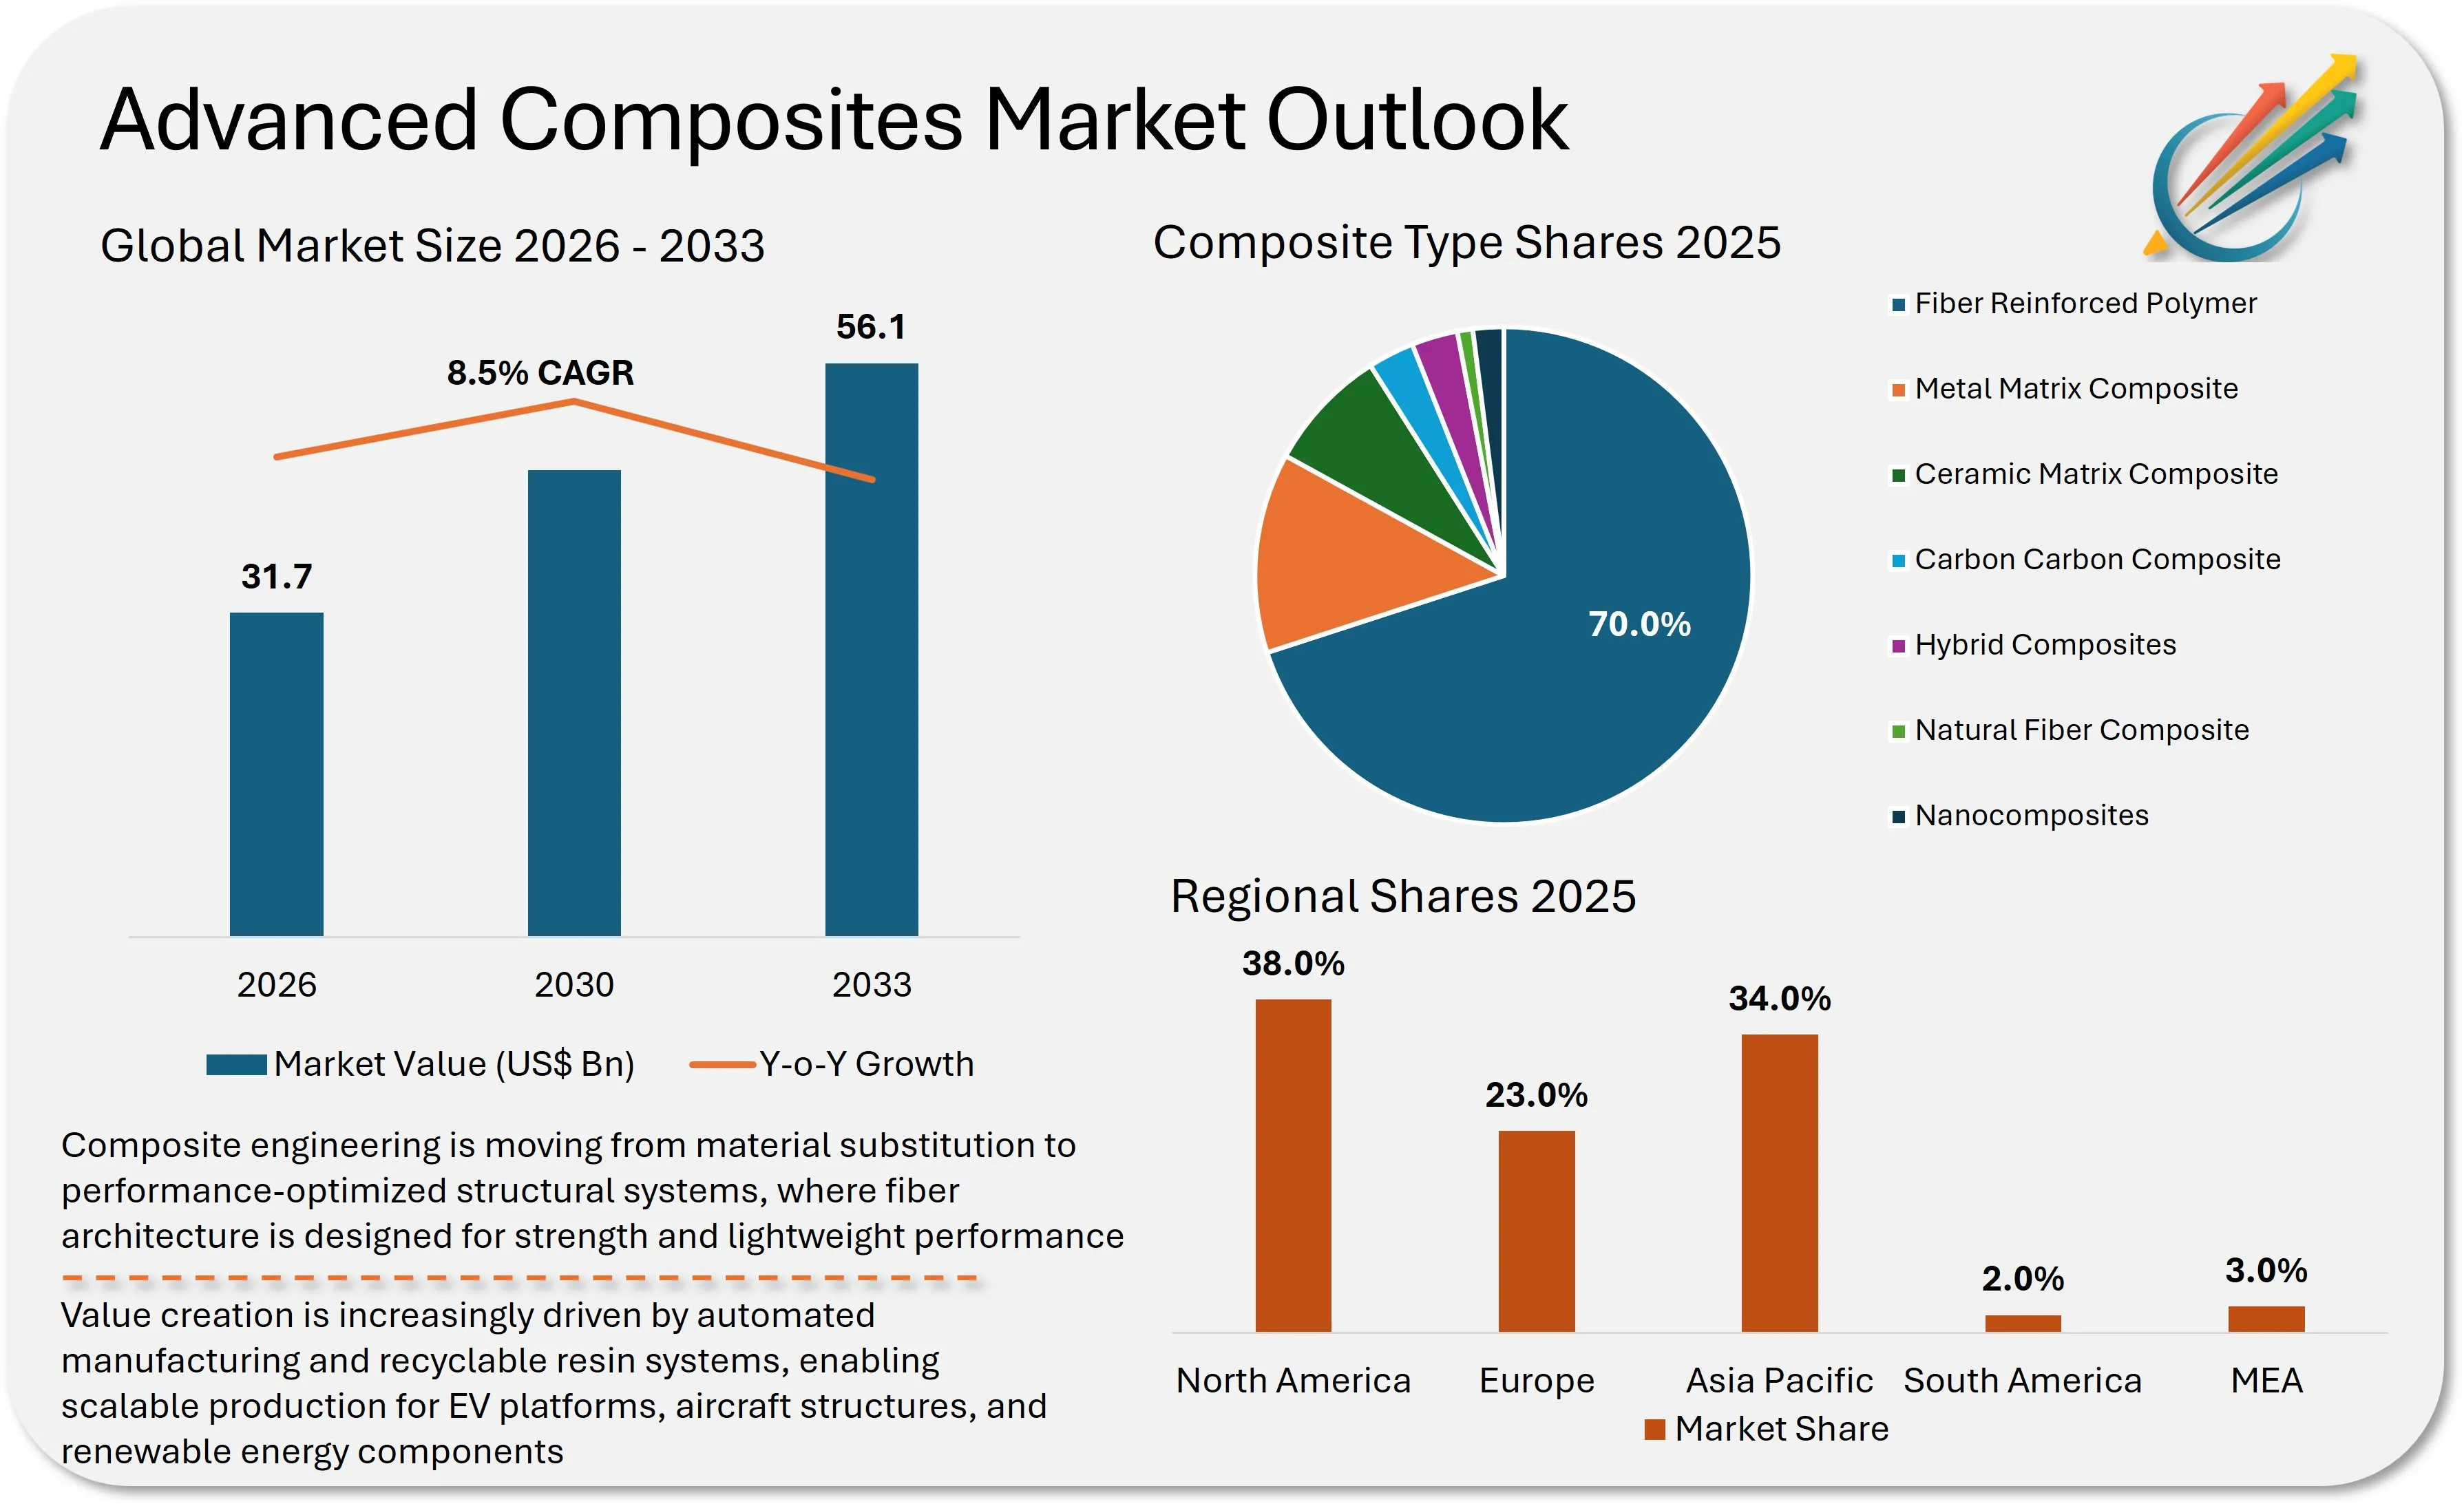
Advanced Composites Market to Reach USD 56.1 Billion by 2033 as Materials Transform Aerospace and EV Design
Manufacturers are accelerating adoption of highstrength lightweight composites to improve fuel efficiency structural performance and sustainability Advanced composites market expanding rapidly as lightweight materials reduce vehicle and aircraft weight by around 3040 Advanced Composites Market Advanced Composites Market Outlook Advanced Composites Market by Key Players Advanced Composites Market Key Players Positioning Matrix Advanced Composites Market Dynamics Advanced Composites Market Dynamics New York NY March 11 2026 GLOBE NEWSWIRE Theadvanced composites market is gaining momentum as enduse industries increasingly demand materials that combine high strength durability and lightweight performance The advanced composites market is estimated to generate a yearly revenue of USD 317 billion in 2026 and is projected to reach USD 561 billion by 2033 witnessing an annualised growth rate of 85 As manufacturers push for zeroemission targets the rapid adoption of thermoplastic resins is revolutionizing highvolume production cycles By embedding highstrength fibers into advanced resins industrial operators are achieving superior stiffness and corrosion resistance The industry is evolving as manufacturers prioritize lightweight design to improve fuel efficiency energy performance emissions reduction etc Aerospace companies are integrating advanced composites into aircraft structures while automotive manufacturers are increasingly adopting them for EVs to offset battery weight Technological advancements in resin systems automated manufacturing processes and recyclable composite materials are reshaping production capabilities As sustainability and performance become core priorities across industries advanced composites are emerging as essential materials for nextgeneration engineering solutions Access the Executive Summary amp Sample Data httpsmarketmindsadvisorycomrequestsamplereportid28105 Key Takeaways from the Advanced Composites Market The advanced composites market is projected to reach USD 561 billion by 2033 growing at 85 CAGR between 2026 and 2033Carbon fiber composites remain a prominent type due to their dominance in aerospace primary structuresThe automated composite manufacturing process is projected to be the fastestgrowing segment during the forecast periodAsiaPacific is emerging as a key investment region driven by massive EV and wind turbine manufacturing scaleRising demand for fireretardant EV battery enclosures is creating new highvolume white spacesGrowing interest in recyclable and biobased composites is reshaping sustainability strategies within the industry Market Dynamics Shaping the Advanced Composites Market Demand for Lightweight and HighPerformance Materials Fostering Advanced Composites Market Increasing demand for lightweight materials across aerospace automotive and renewable energy sectors is driving the advanced composites market Advanced composites offer excellent strengthtoweight ratios enabling manufacturers to design lighter structures without compromising durability In aerospace reducing aircraft weight improves fuel efficiency and operational performance Further EV manufacturers rely on lightweight composite components to offset the additional weight of batteries Wind turbine blades require advanced composites to achieve higher efficiency and durability As industries continue prioritizing performance optimization and energy efficiency the advanced composites market is expected to expand steadily Expanding Applications in EV and Renewable Energy creating Immense Growth Opportunities for Advanced Composites Market Growth in EV production and renewable energy infrastructure is creating ample opportunities for key market players EV manufacturers are increasingly incorporating composite materials in vehicle bodies battery enclosures and structural components to improve energy efficiency and driving range In the renewable energy sector wind turbine blades rely heavily on advanced composites due to their ability to withstand high mechanical stress while remaining lightweight Additionally innovations in recyclable composites and biobased resin systems are opening white spaces aligned with sustainability goals these emerging applications are expanding lucrative business opportunities for advanced composites market participants Request RegionSegmentsSpecific Data Analysis httpsmarketmindsadvisorycomrequestcustomizationreportid28105 Production Costs and Complex Manufacturing Processes Impacting Advanced Composites Market Growth Advanced composites face adoption barriers due to high production costs and complex manufacturing requirements Carbon fiber and specialized resins are substantially more expensive than traditional materials such as steel or aluminum Manufacturing processes including autoclave curing resin transfer molding and filament winding often require specialized equipment and skilled labor These factors increase capital investment and production timelines Moreover recycling and endoflife management of composite materials remain challenging for advanced composites market due to their multimaterial structure Advanced Composites Market Segmentation By Composite Type Fiber Reinforced PolymerMetal Matrix CompositeCeramic Matrix CompositeCarbonCarbon CompositeHybrid CompositesNatural Fiber CompositeNanocomposites Fiber reinforced polymer accounts for majority of sales in advanced composites market owing to their exceptional strengthtoweight ratio and high stiffness properties These materials are used in aerospace structures automotive components highperformance sporting equipment and others Glass fiber composites continue to maintain strong demand because they offer a costeffective alternative for industrial and infrastructure applications As industries seek stronger and lighter materials carbon fiber composites are expected to remain in high demand while complex matrix based composites gain traction in niche applications By Resin Type Epoxy ResinPolyester ResinVinyl EsterPolyimidePolyether Ether Ketone PEEKPolyphenylene Sulfide PPSOthers Epoxy resins account for a key share in the advanced composites market due to their superior mechanical strength chemical resistance excellent adhesion properties etc These resins are widely used in aerospace and wind energy applications where structural performance is critical Polyester resins are commonly used in industrial and marine applications due to their affordability and ease of processing Vinyl ester resins provide improved corrosion resistance making them suitable for chemical and infrastructure applications By Manufacturing Process Hand LayupVacuum Infusion MoldingResin Transfer Molding RTMCompression MoldingPultrusionFilament WindingAutoclave CuringOut of Autoclave ProcessingAutomated Fiber Placement AFP Manufacturing processes play a crucial role in determining the performance and scalability of advanced composite components Resin transfer molding and filament winding are widely used processes due to their efficiency in producing complex structures with consistent quality Pultrusion is commonly applied in the production of continuous composite profiles used in construction and infrastructure applications Automated fiber placement is gaining traction in aerospace manufacturing as it allows precise placement of carbon fibers and reduces production time Increasing automation in the manufacturing is expected to improve scalability and reduce production costs over time and benefiting advanced composites market players By Application Structural ComponentsExterior Body PanelsInterior Trim ComponentsPressure Vessels and TanksFan Blades and RotorsMarine Hulls and SuperstructuresEquipmentOthers Structural components account for a key share in terms of demand due to their extensive use in aerospace and automotive engineering These components require materials that provide high strength and durability while maintaining low weight Interior components in aircraft and vehicles utilize advanced composites for improved design flexibility and weight reduction Pipes and tanks made from composite materials are widely used in industrial sectors due to their corrosion resistance Wind turbine blades represent a rapidly growing application in the advanced composites market as renewable energy installations expand globally requiring large and durable composite structures By Industry Vertical Aerospace and DefenseAutomotive and TransportationWind EnergyMarine and ShipbuildingConstruction and InfrastructureIndustrial Machinery and EquipmentSports and LeisureMedical Devices and HealthcareOil and GasRail and Mass TransitOthers Aerospace and defense sector accounts for a key share of demand for advanced composites as aircraft manufacturers increasingly rely on lightweight materials to improve fuel efficiency and structural performance Automotive manufacturers are also adopting advanced composites in vehicle components to meet emissions regulations and enhance electric vehicle performance Wind energy represents one of the fastestgrowing industry verticals as turbine blades rely heavily on composite materials Construction and marine industries utilize composites for infrastructure and structural applications due to their corrosion resistance and durability and is gaining traction in advanced composites market By Region North AmericaEuropeAsia PacificSouth AmericaMEA North America accounts for a significant share of the advanced composites market due to strong aerospace manufacturing activity in the US and ongoing investments in defense technologies Europe led by Germany France UK and others continues to expand its use of advanced composites in automotive and renewable energy sectors AsiaPacific is emerging as the fastestgrowing region especially in China where industrialization and EV manufacturing are driving demand while Japan continues to lead in premium carbon fiber innovation Secure Full Access to DecisionGrade Data httpsmarketmindsadvisorycombuynowreportid28105 Competitive Landscape Advanced Composites Market The advanced composites market features a mix of global material manufacturers aerospace suppliers and specialized composite technology companies Key market participants are investing in innovation in carbon fiber technologies development of recyclable composite materials strategic partnerships with aerospace and automotive manufacturers Key players are also focusing on acquiring medium size players to bolster their market positions across other regions and to fuel their supply capability by boosting their product portfolio Market players are also investing in automated manufacturing processes and vertical chain integration strategies to improve production efficiency and reduce costs Key Players in Advanced Composites Market are Toray IndustriesTeijin LimitedMitsubishi Chemical CorporationSolvay SAHexcel CorporationSGL Carbon SEGurit Holding AGOwens CorningHuntsman CorporationVictrex plcJushi Group Co LtdKordsa Teknik TekstilSaertex GmbHBASF SEPPG IndustriesSaintGobainRoyal TenCateAxiom MaterialsSIKA AGDuPontDowAksa Advanced CompositesHyosung Key Developments In March 2025 Airbus and Boeing aggressively scaled jet production lines heavily leveraging new thermoplastic composites and fastcuring technologies to enhance manufacturing speed and structural performanceIn June 2025 Dow signed a sale and purchase agreement to divest its 50 stake in DowAksa Advanced Composites Holdings BV to Aksa Akrilik a subsidiary of Akkk HoldingIn 2025 Toray announced the expansion of its South Carolina facility to manufacture defensegrade carbon fiber precursor strengthening its role as a key supplier to the US Department of DefenseIn December 2025 the reintegration of Spirit AeroSystems into Boeing streamlined the aerospace supply chain reducing operational friction for composite fuselage suppliers while putting margin pressure on lowertier vendors Explore the Full Industry Intelligence Suite httpsmarketmindsadvisorycomadvancedcompositesmarket Trending Related Reports The high performance insulation material market is projected to expand remarkably climbing from USD 1443 billion in 2025 to USD 3913 billion by 2035 at a robust CAGR of 12 The global advanced automotive materials market is anticipated to experience robust growth projected to expand at a CAGR of 78 during the forecast period from 2025 to 2035 The advanced polymer composites market is poised for robust expansion driven by increasing demand across aerospace automotive wind energy and construction sectors The automotive composites market is poised for significant growth expanding from USD 93 billion in 2025 to USD 271 billion by 2035 registering a robust CAGR of 131 over the forecast period The high performance composites market is expected to witness substantial growth projected to increase from USD 149 billion in 2025 to USD 378 billion by 2035 at a robust CAGR of 113 during the forecast period The glass fiber reinforced plastic composites market is set to grow substantially with its valuation projected to rise from USD 1954 billion in 2025 to USD 4253 billion by 2035 expanding at a CAGR of 94 during the forecast period The AsiaPacific biocomposites market is set to achieve remarkable growth with its market value projected to rise from USD 87 billion in 2024 to USD 288 billion by 2034 reflecting a robust CAGR of 144 The market of carbon fiber is estimated to be valued at around USD 57 billion in 2026 and is projected to surpass USD 101 billion by 2033 expanding at a CAGR of 87 over the forecast period The carbon fiber composites market is projected to grow significantly rising from USD 2199 billion in 2024 to USD 4041 billion by 2034 with a CAGR of 75 during the forecast period The Recycled Carbon Fiber Market is projected to witness substantial growth reaching an estimated valuation of USD 569 million in 2025 with a robust CAGR of 133 through 2035 Why choose Market Minds Advisory Market Minds Advisory delivers decisiongrade intelligence trusted by executives across machinery amp equipment packaging chemical automotive information amp communication technology food amp beverage consumer goods healthcare and other industries We provide market expansion strategies gotomarket strategies market share acceleration brand positioning analysis and account enablement and growth Our forecasting methodology integrates primary interviews proprietary demand models and continuous market validation to ensure accuracy in volatile and emerging industries With over 10 years of industry experience and insights derived from primary interviews with several industry stakeholders our research provides actionable insights and white space analysis for the emerging segments providing the opportunity gaps in the market accounting recent market developments and geopolitical risks We believe in unlocking growth by helping businesses to see the future of their markets Contact Us Market Minds Advisory 86 Great Portland Street Mayfair London W1W 7FG England United Kingdom T 44 020 3807 7725 Email salesmarketmindsadvisorycom Website httpsmarketmindsadvisorycom LinkedIn Facebook Twitter Instagram Attachments Advanced Composites Market Advanced Composites Market by Key Players Advanced Composites Market Dynamics CONTACT Contact Us Market Minds Advisory 86 Great Portland Street Mayfair London W1W 7FG England United Kingdom T 44 020 3807 7725
Syensqo appoints Heike van de Kerkhof as Chair of the Board of Directors
Press releaseCommuniqu de pressePersbericht Regulated information Syensqo appoints Heike van de Kerkhof as Chair of the Board of Directors Brussels Belgium March 3 2026 0730 CET SYENSQO SA Syensqo or the Company today announces the appointment of Heike van de Kerkhof as independent Chair of its Board of Directors Board effective March 3 2026 marking a new step in the Groups Governance journey She will succeed Rosemary Thorne who will step down as chair with immediate effect and from her position as independent director on March 31 2026 to ensure a smooth handover process Heike van de Kerkhof has been an independent Director of Syensqo since December 2023 and currently chairs the Boards Nomination Committee She is a seasoned global executive with more than three decades of experience in specialty chemicals materials and energy As Chief Executive Officer of Archroma from 2020 to 2023 she led a global transformation focused on performance portfolio optimization and sustainability Her earlier leadership roles at BP Castrol Chemours and DuPont provide deep operational and strategic insight across global industrial businesses She also served on the boards of Neste OCI NV and Goodpack Her combination of CEO experience governance expertise and strong industrial background positions her well to lead the Board in this next phase The Board warmly thanks Rosemary Thorne for her leadership and commitment in guiding the Company through a pivotal phase of its development and looks forward with confidence to the next chapter under Heike van de Kerkhofs chairmanship The Company also announces that Roeland Baan stepped down from the Board on March 2 2026 for personal reasons after having made a significant contribution through his expertise and strong engagement over the years In particular he has played an important role as a member of both the ESG Committee and the Audit and Risk Committee where his insights have helped strengthen the Companys oversight and governance The Company wishes to express its sincere gratitude to him for his commitment and valuable service to the Board and to all its stakeholders In this context the Board welcomes Miguel Mantas former CEO of Allnex as an independent director bringing a strong track record in driving growth portfolio transformation and complex crossborder transactions He combines deep experience in largescale industrial businesses with proven leadership of highperforming international teams across Europe Asia and Latin America This Board evolution comes at an important moment for Syensqo as the Company strengthens its Board to address new challenges and opportunities ahead The nomination of Heike van de Kerkhof as Chair of the Board and the arrival of Miguel Mantas as independent director follow Mike Radossichs appointment as Chief Executive Officer on January 1 2026 as the Company advances to its next phase with a clear focus on disciplined execution operational excellence and accelerated value creation The Nomination Committee will seek to appoint at least one additional independent director in the coming months to further enhance the Boards expertise and maintain robust governance standards including majority independence across key Committees Heike van de Kerkhof said I am honored to take on the role of chair at this important time for Syensqo The Board is fully committed to supporting management in strengthening performance maintaining high standards of governance and delivering longterm value for our shareholders Full press release available here About Syensqo Syensqo is a science company developing groundbreaking solutions that enhance the way we live work travel and play Inspired by the scientific councils which Ernest Solvay initiated in 1911 we bring great minds together to push the limits of science and innovation for the benefit of our customers with a diverse global team of more than 13000 associates in 30 countries Our solutions contribute to safer cleaner and more sustainable products found in homes food and consumer goods planes cars batteries smart devices and healthcare applications Our innovation power enables us to deliver on the ambition of a circular economy and explore breakthrough technologies that advance humanity Learn more at wwwsyensqocom Contacts Media Relationsmediarelationssyensqocom Perrine Marchal32 478 32 62 72Laetitia Schreiber32 487 74 38 07Investors amp Analystsinvestorrelationssyensqocom Sherief Bakr44 7920 575 989Robbin MooreRandolph1 470 493 2433Loc Flament32 478 69 74 20Eva Behaeghe32 474 49 23 50 Safe harborThis press release may contain forwardlooking information Forwardlooking statements describe expectations plans strategies goals future events or intentions The achievement of forwardlooking statements contained in this press release is subject to risks and uncertainties relating to a number of factors including general economic factors interest rate and foreign currency exchange rate fluctuations changing market conditions product competition the nature of product development impact of acquisitions and divestitures restructurings products withdrawals regulatory approval processes allin scenario of RampI projects and other unusual items Consequently actual results or future events may differ materially from those expressed or implied by such forwardlooking statements Should known or unknown risks or uncertainties materialize or should our assumptions prove inaccurate actual results could vary materially from those anticipated The Company undertakes no obligation to publicly update or revise any forwardlooking statements Useful links Earnings materialsStrategyShare informationCredit informationSeparation documentsWebcasts podcasts and presentationsAnnual Integrated ReportSubscribe to our distribution list Syensqo nomme Heike van de Kerkhof Prsidente du Conseil dadministration Bruxelles Belgique 3 mars 2026 0730 CET SYENSQO SA Syensqo ou la Socit annonce aujourdhui la nomination de Heike van de Kerkhof en tant que Prsidente indpendante de son Conseil dadministration Conseil avec effet au 3 mars 2026 marquant une nouvelle tape dans le parcours de gouvernance du Groupe Elle succdera Rosemary Thorne qui quittera ses fonctions de Prsidente et dmissionnera de son mandat dadministratrice indpendante le 31 mars 2026 afin dassurer un passage de relais en douceur Heike van de Kerkhof est administratrice indpendante de Syensqo depuis dcembre 2023 et prside actuellement le Comit des nominations du Conseil Elle est une dirigeante internationale chevronne forte de plus de trente ans dexprience dans les secteurs des produits chimiques de spcialit des matriaux et de lnergie En qualit de Directrice gnrale Chief Executive Officer dArchroma de 2020 2023 elle a conduit une transformation globale axe sur la performance loptimisation du portefeuille et le dveloppement durable Ses prcdentes fonctions de direction au sein de BP Castrol Chemours et DuPont lui confrent une connaissance oprationnelle et stratgique approfondie des groupes industriels mondiaux Elle a galement sig aux conseils dadministration de Neste dOCI NV et de Goodpack La combinaison de son exprience de CEO de son expertise en matire de gouvernance et de son solide parcours industriel la positionne idalement pour diriger le Conseil dans cette nouvelle phase Le Conseil remercie chaleureusement Rosemary Thorne pour son leadership et son engagement dans laccompagnement de la Socit au cours dune phase charnire de son dveloppement et aborde avec confiance le prochain chapitre sous la prsidence de Heike van de Kerkhof La Socit annonce galement que Roeland Baan a quitt le Conseil le 2 mars 2026 pour des raisons personnelles aprs y avoir apport une contribution significative grce son expertise et son engagement de longue date Il a en particulier jou un rle important en tant que membre des comits ESG et dAudit et des Risques o ses analyses ont contribu renforcer les dispositifs de contrle et de gouvernance de la Socit La Socit tient lui exprimer sa profonde gratitude pour son engagement et les services prcieux rendus au Conseil et lensemble de ses parties prenantes Dans ce contexte le Conseil accueille Miguel Mantas ancien CEO dAllnex en tant quadministrateur indpendant fort dune solide exprience de CEO dans la conduite de la croissance la transformation de portefeuille et des oprations complexes transfrontalires Il associe une exprience approfondie au sein de groupes industriels de grande envergure un leadership prouv la tte dquipes internationales trs performantes en Europe en Asie et en Amrique latine Cette volution de la composition du Conseil intervient un moment important pour Syensqo alors que la Socit renforce son Conseil pour faire face aux nouveaux dfis et saisir les opportunits venir La nomination de Heike van de Kerkhof la prsidence du Conseil et larrive de Miguel Mantas en qualit dadministrateur indpendant font suite la nomination de Mike Radossich en tant que Directeur gnral Chief Executive Officer le 1er janvier 2026 la Socit abordant une nouvelle phase de son dveloppement avec un cap clair en matire dexcution discipline dexcellence oprationnelle et dacclration de la cration de valeur Le Comit des nominations recherchera dans les prochains mois proposer la nomination dau moins un administrateur indpendant supplmentaire afin de poursuivre le renforcement des comptences au sein du Conseil et de maintenir des standards de gouvernance exigeants notamment une majorit dadministrateurs indpendants au sein des principaux comits Heike van de Kerkhof a dclar Je suis honore dassumer la fonction de Prsidente un moment aussi important pour Syensqo Le Conseil est pleinement engag aux cts du management pour renforcer la performance maintenir des standards levs de gouvernance et crer de la valeur long terme pour nos actionnaires Le communiqu de presse complet est disponible ici A propos de Syensqo Syensqo est une entreprise fonde sur la science qui dveloppe des solutions novatrices permettant damliorer notre faon de vivre de travailler de voyager et de nous divertir Inspirs par les congrs scientifiques initis par Ernest Solvay en 1911 nous runissons des talents brillants qui repoussent sans cesse les limites de la science et de linnovation au profit de nos clients avec plus de 13 000 employs Nous dveloppons des solutions qui contribuent offrir des produits plus srs plus propres et plus durables que lon retrouve dans lhabitat lalimentation et les biens de consommation les avions les voitures les batteries les appareils lectroniques et les soins de sant Notre force dinnovation nous permet de concrtiser lambition dune conomie circulaire et dexplorer des technologies rvolutionnaires qui feront progresser lhumanit Plus dinformations sur wwwsyensqocom Contacts Media Relationsmediarelationssyensqocom Perrine Marchal32 478 32 62 72Laetitia Schreiber32 487 74 38 07Investors amp Analystsinvestorrelationssyensqocom Sherief Bakr44 7920 575 989Robbin MooreRandolph1 470 493 2433Loc Flament32 478 69 74 20Eva Behaeghe32 474 49 23 50 Informations prospectivesCe communiqu peut contenir des informations prospectives Les dclarations prospectives dcrivent les attentes plans stratgies objectifs vnements futurs ou intentions La ralisation des dclarations prospectives contenues dans ce communiqu est sujette des risques et des incertitudes en raison dun certain nombre de facteurs y compris des facteurs conomiques dordre gnral les fluctuations des taux dintrt et des taux de change lvolution des conditions de march la concurrence des produits la nature du dveloppement dun produit limpact des acquisitions et des dsinvestissements des restructurations du retrait de certains produits du processus dapprobation rglementaire des scnarii globaux des projets de RampI et dautres lments inhabituels Par consquent les rsultats rels ou vnements futurs peuvent diffrer sensiblement de ceux exprims ou implicites dans ces dclarations prospectives Si de tels risques connus ou inconnus ou des incertitudes se concrtisent ou si nos hypothses savraient inexactes les rsultats rels pourraient diffrer considrablement de ceux anticips La socit ne sengage nullement mettre jour publiquement ses dclarations prospectives Liens utiles Informations financiresStratgieLe titre SyensqoObligations et notation financireSeparation documentsWebcasts podcasts et prsentationsRapport Annuel IntgrSinscrire notre liste de diffusion Syensqo benoemt Heike van de Kerkhof tot voorzitter van de Raad van Bestuur Brussel Belgi 3 maart 2026 0730 CET SYENSQO SA Syensqo of de Groep kondigt vandaag de benoeming aan van Heike van de Kerkhof tot onafhankelijk voorzitter van zijn Raad van Bestuur Raad met ingang van 3 maart 2026 wat een nieuwe stap betekent in de Governance van de Groep Zij zal Rosemary Thorne opvolgen die met onmiddellijke ingang terugtreedt als voorzitter en op 31 maart 2026 ontslag zal nemen uit haar functie als onafhankelijk bestuurder om zo een vlot overdrachtsproces te verzekeren Heike van de Kerkhof is sinds december 2023 onafhankelijk bestuurder van Syensqo en is momenteel voorzitter van het Benoemingscomit van de Raad Zij is een ervaren internationaal topmanager met meer dan drie decennia ervaring in speciaalchemie materialen en energie Als Chief Executive Officer van Archroma van 2020 tot 2023 leidde zij een wereldwijde transformatie gericht op prestaties portfoliooptimalisatie en duurzaamheid Haar eerdere leiderschapsrollen bij BP Castrol Chemours en DuPont verschaffen haar diepgaande operationele en strategische inzichten in internationale industrile ondernemingen Zij was daarnaast lid van de raden van bestuur van Neste OCI NV en Goodpack Haar combinatie van CEOervaring governanceexpertise en sterke industrile achtergrond maakt haar bijzonder geschikt om de Raad te leiden in deze volgende fase De Raad dankt Rosemary Thorne van harte voor haar leiderschap en inzet bij het begeleiden van de Groep door een cruciale fase in zijn ontwikkeling en kijkt met vertrouwen uit naar het volgende hoofdstuk onder het voorzitterschap van Heike van de Kerkhof De Groep kondigt ook aan dat Roeland Baan om persoonlijke redenen op 2 maart 2026 uit de Raad terugtrad nadat hij door zijn expertise en sterke betrokkenheid gedurende vele jaren een belangrijke bijdrage heeft geleverd In het bijzonder heeft hij een belangrijke rol gespeeld als lid van zowel het ESGcomit als het Audit en Risicocomit waar zijn inzichten hebben bijgedragen aan het versterken van het toezicht en de Governance van de Groep De Groep wenst zijn oprechte dank uit te spreken voor zijn inzet en waardevolle dienstverlening aan de Raad en aan al zijn stakeholders In deze context heet de Raad ook Miguel Mantas voormalig CEO van Allnex welkom als onafhankelijk bestuurder die een sterk track record inbrengt op het gebied van groei portfolio transformatie en complexe grensoverschrijdende transacties Hij combineert diepgaande ervaring in grootschalige industrile ondernemingen met bewezen leiderschap van hoogpresterende internationale teams in Europa Azi en LatijnsAmerika Deze evolutie in de Raad komt op een belangrijk moment voor Syensqo nu de Groep zijn Raad versterkt om nieuwe uitdagingen en kansen het hoofd te bieden De benoeming van Heike van de Kerkhof tot voorzitter van de Raad en de komst van Miguel Mantas als onafhankelijk bestuurder volgen op de aanstelling van Mike Radossich als Chief Executive Officer op 1 januari 2026 terwijl de Groep haar volgende fase ingaat met een duidelijke focus op gedisciplineerde uitvoering operationele uitmuntendheid en versnelde waardecreatie Het Benoemingscomit zal in de komende maanden ten minste n extra onafhankelijke bestuurder benoemen om de expertise van de Raad verder te versterken en robuuste Governancenormen te handhaven waaronder een meerderheid aan onafhankelijke leden in de belangrijkste comits Heike van de Kerkhof verklaarde Het is een eer om in deze voor Syensqo belangrijke periode de rol van voorzitter op te nemen De Raad zet zich er volledig voor in het management te ondersteunen bij het versterken van de prestaties het handhaven van hoge Governancenormen en het realiseren van langetermijnwaarde voor onze aandeelhoudersVolledig persbericht hier beschikbaar Over Syensqo Syensqo is een wetenschapsbedrijf dat baanbrekende oplossingen ontwikkelt die de manier waarop we leven werken reizen en ons vermaken verbeteren Genspireerd door de wetenschappelijke raden die Ernest Syensqo in 1911 organiseerde brengen we het briljante talent samen dat de grenzen van wetenschap en innovatie verlegt ten voordele van onze klanten met een wereldwijd team van meer dan 13000 Onze oplossingen dragen bij aan veiligere schonere en duurzamere producten in huizen voeding en consumptiegoederen vliegtuigen autos batterijen slimme apparaten en toepassingen in de gezondheidszorg Onze innovatiekracht stelt ons in staat om de ambitie van een circulaire economie waar te maken en baanbrekende technologien te ontwikkelen die de mensheid vooruit helpen Meer informatie op wwwsyensqocom Contacts Media Relationsmediarelationssyensqocom Perrine Marchal32 478 32 62 72Laetitia Schreiber32 487 74 38 07Investors amp Analystsinvestorrelationssyensqocom Sherief Bakr44 7920 575 989Robbin MooreRandolph1 470 493 2433Loc Flament32 478 69 74 20Eva Behaeghe32 474 49 23 50 Wettelijke bepaling als bescherming tegen onredelijke aansprakelijkheidsstellingenDit persbericht kan toekomstgerichte informatie bevatten Toekomstgerichte verklaringen beschrijven verwachtingen plannen strategien doelen toekomstige gebeurtenissen of intenties De verwezenlijking van toekomstgerichte verklaringen die in dit persbericht staan is onderworpen aan en is afhankelijk van risicos en onzekerheden verbonden aan verschillende factoren waaronder algemene economische factoren schommelingen van interestvoeten en wisselkoersen veranderende marktcondities concurrentie op producten de aard van de productontwikkeling het effect van verwervingen en verkopen herstructureringen terugtrekkingen van producten goedkeuringen door regelgevers het allin scenario van onderzoeks en innovatieprojecten en andere ongebruikelijke zaken Om deze reden kunnen de actuele of toekomstige resultaten wezenlijk afwijken van de resultaat die expliciet gemeld worden of impliciet besloten zijn in dergelijke toekomstgerichte verklaringen Mochten bekende of onbekende risicos of onzekerheden zich voltrekken of mochten onze aannames onjuist blijken te zijn dan kunnen de daadwerkelijke resultaten sterk afwijken van de verwachte resultaten Syensqo verplicht zich niet om toekomstgerichte verklaringen publiekelijk te actualiseren of te herzien Nuttige links Results documentationStrategieDeel informatieKredietinformatieSeparatiedocumentenWebcasts podcasts en presentationsGentegreerd jaarverslagSchrijf je in voor onze mailinglijst Attachments 20260303 New BoD Chair FR 20260303 New BoD Chair EN 20260303 New BoD Chair NL
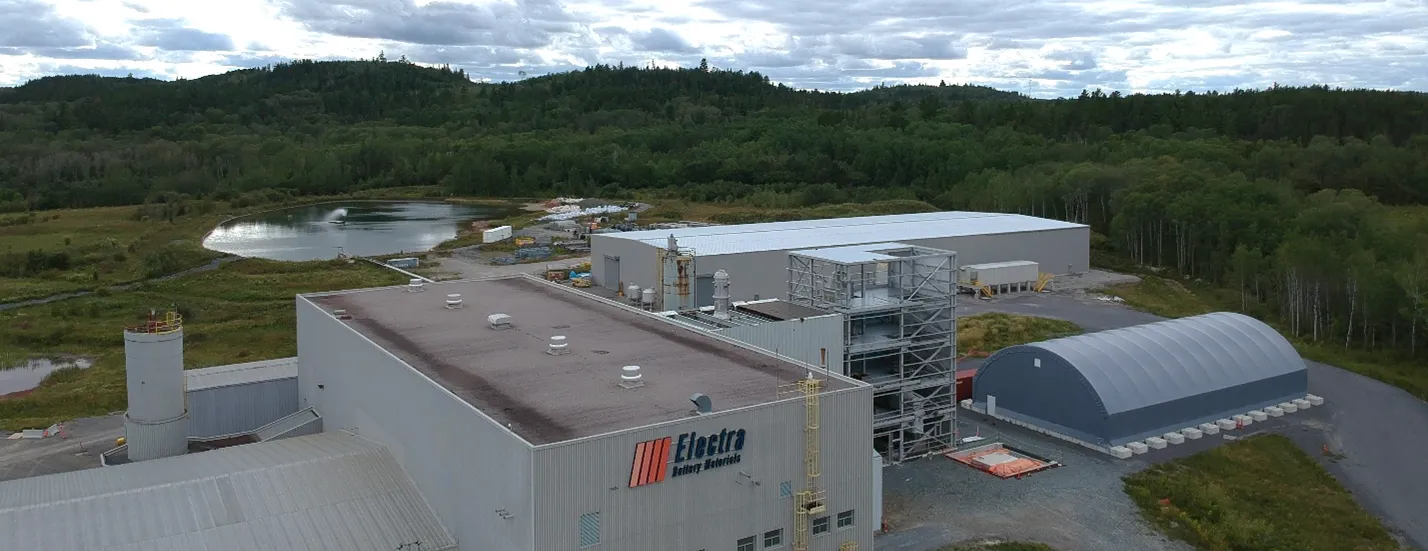
Electra Approves Construction Budget and Sets Schedule for Completion of its North American Cobalt Sulfate Refinery
All amounts in US unless otherwise stated TORONTO Feb 23 2026 GLOBE NEWSWIRE Electra Battery Materials Corporation NASDAQ ELBM TSXV ELBM Electra or the Company today announced that its Board of Directors has approved a 73 million construction budget and established an execution schedule to achieve mechanical completion of its cobalt sulfate Refinery north of Toronto marking a significant step toward bringing North Americas first batterygrade cobalt refinery into operation Commissioning activities are expected to commence in the fourth quarter of 2026 Mechanical completion is targeted for the second quarter of 2027 Production rampup is expected to start during the third quarter of 2027 Achievement of Commercial Production is targeted for the fourth quarter of 2027 The project schedule establishes a clear pathway from construction execution in 2026 to commercial operations in 2027 Our mandate is clear We are advancing this Refinery to completion with a defined budget schedule and execution plan said Trent Mell CEO This is a fully permitted brownfield asset with substantial infrastructure in place and funding commitments from allied governments With major equipment procured and construction sequencing defined and baselined we are positioned to transition from reactivation to full execution Project Budget amp Schedule The approved 73 million C100 million construction budget reflects updated detailed engineering contractor input and current market pricing It is intended to fund all remaining construction activities through mechanical completion Select commissioning activities are expected to begin prior to mechanical completion with integrated commissioning and production rampup to follow completion of major construction works The majority of major mechanical and electrical equipment has been procured and longlead items delivered to site significantly reducing procurement and supply chain risk Engineering and construction sequencing is substantially advanced and baselined providing enhanced cost visibility and schedule certainty Construction will proceed under a defined execution plan with the following target milestones Q1 2026 Award of SMPEI contract structural mechanical piping electrical and instrumentationQ2 2026 Full site mobilizationQ4 2026 Early commissioning of select utilities and circuitsQ2 2027 Mechanical completionQ3 2027 Start of production rampupQ4 2027 Commercial production Project Funding amp Government Support Electra has arranged approximately 82 million in aggregate financial support to fund Refinery construction including 48 million in government grants and loans and 34 million in equity financing completed in October 2025 Total committed capital exceeds the approved construction budget The Refinery has secured funding commitments from the US Department of Defense the Government of Canada and the Province of Ontario underscoring its strategic importance to North American critical minerals supply chains The Company believes it has sufficient committed capital and liquidity to achieve mechanical completion subject to customary reimbursement timing associated with government funding programs To further support the implementation of the previously announced construction funding plan the Company has commenced discussions with the lenders of the Companys senior secured credit facility to amend certain terms of the Companys existing credit agreement dated October 22 2025 The proposed amendments are intended to support ongoing negotiations to implement the previously announced funding for construction of the Refinery by allowing the Company to incur up to 27 million of debt financing from government entities some or all of which may be secured There can be no assurance the lenders will agree to any such changes to the current terms of their loan agreement Capital requirements beyond mechanical completion will primarily relate to commissioning operational readiness initial working capital and corporate costs as the Refinery transitions to commercial production Commissioning and rampup expenditures are anticipated to be approximately 15 million C205 million The Company expects these requirements to be managed through available liquidity and customary working capital facilities as the Refinery transitions to operations Electras North American Refinery The Refinery is designed to initially produce 5120 tonnes per annum of contained cobalt in the form of batterygrade cobalt sulfate At nameplate capacity the Refinery is expected to generate meaningful revenue from batterygrade cobalt sulfate supply to North American and allied markets The crystallizer circuit has a nameplate capacity of 6500 tonnes per annum providing a pathway to expand production by approximately 27 beyond initial nameplate capacity Electra is targeting optimization toward the full 6500 tonne per annum level in 2028 through incremental capital investments operational improvements and debottlenecking initiatives Engineering studies to evaluate expansion to full crystallizer capacity will be completed during initial commissioning and rampup and will incorporate plant performance data and operating insights generated during early production Over the past 12 months benchmark cobalt sulfate prices have increased approximately threefold reflecting improved supply discipline and sustained demand growth The lithiumion battery sector a core end market for cobalt sulfate continues to expand growing 29 yearoveryear to reach an estimated 159 TWh in 2025 according to Rho Motion Approximately 75 of this demand was attributable to the 207 million electric vehicles sold globally in 2025 In December 2025 the United States and the Democratic Republic of the Congo signed a Strategic Partnership Agreement focused on critical minerals cooperation underscoring the geopolitical and national security importance of secure and diversified cobalt supply chains In parallel evolving guidance under Section 45X of the US Advanced Manufacturing Production Credit has introduced increased scrutiny of upstream sourcing and material assistance from Prohibited Foreign Entities PFEs As upstream content thresholds increase over time allied and traceable precursor materials are expected to play a growing role in maintaining 45X eligibility Electra believes its North American refining platform can support customers seeking to preserve and strengthen credit eligibility by providing an allied traceable and nonPFE upstream input Qualification under applicable programs will depend on specific statutory and regulatory criteria Industry estimates indicate that approximately 89 thousand metric tonnes kt of incremental global cobalt demand was added in 2025 with a further 92 kt of demand growth forecast for 2026 Benchmark Mineral Intelligence A growing portion of this incremental demand is expected to seek supply from jurisdictions outside China reflecting customer and policydriven diversification strategies Once fully ramped up to 6500 tonnes Electras Refinery is expected to represent an estimated 27 of world supply excluding China and approximately 5 of total global cobalt sulfate supply based on Darton Commodities current market data and demand forecasts The Company has feedstock supply arrangements with leading global cobalt producers and trading counterparties including Glencore and other established operators Electra has also entered into a longterm tolling arrangement framework with LG Energy Solution which is expected to account for approximately 60 of initial production over the first five years of operations With a defined commissioning schedule in place the Company is advancing definitive commercial documentation with these and other counterparties Construction is being delivered under a joint engineering procurement and construction management framework led by EXP in collaboration with Electras internal owners team This model provides integrated oversight strengthened cost control and disciplined execution under a single coordinated framework Construction restart activities commenced in the fourth quarter of 2025 focused on early works and site readiness Award of the major SMPEI contract is expected in the first quarter of 2026 followed by full site mobilization The Refinery is a fully permitted brownfield site that previously produced nickel and cobalt and retains substantial existing infrastructure including utilities process buildings and site services Construction activities initiated in 20222023 included site infrastructure as well as significant structural and mechanical work During the subsequent project pause the Company successfully operated portions of the facility as part of a battery black mass demonstration campaign validating key process circuits and preserving operational capability Recent work completed from the fourth quarter of 2025 to date includes the following construction and site preparation activities supporting an efficient transition to full mobilization under the updated schedule Installation of pipe racks and major structural componentsInstallation of clarifier tanksPower infrastructure upgrades andPreparation of parking and laydown areas to support construction trailers workforce and equipment Longlead equipment is in place other equipment orders have been advanced construction sequencing is near finalization and project controls have been implemented in alignment with the approved budget Electra believes its Refinery will be North Americas only batterygrade cobalt sulfate production facility upon commissioning addressing a key vulnerability in the regional battery materials supply chain Global refining capacity for batterygrade cobalt remains highly concentrated in Asia Establishing domestic refining capacity in Canada directly supports United States and Canadian national security priorities by strengthening allied supply chains reducing reliance on foreign processing and enhancing the resilience of critical mineral supply for defense and industrial applications Cobalt refining is a strategic capability for North America noted Mell By bringing this facility into commercial operation in 2027 we will establish the only batterygrade cobalt sulfate production capacity in the region strengthening allied supply chains and anchoring critical minerals partnerships within North America The United States and allied governments have increased engagement with producing nations to support secure and responsible cobalt supply chains This refinery provides the midstream capability required to convert upstream resource partnerships into domestic cobalt supply for North American markets About Electra Battery Materials Electra is a leader in advancing North Americas critical minerals supply chain for lithiumion batteries The Companys primary focus is constructing North Americas only cobalt sulfate Refinery as part of a phased strategy to onshore critical minerals refining and reduce reliance on foreign supply chains In addition to the Refinery Electra holds a significant land package in Idahos Cobalt Belt including its Iron Creek project and surrounding properties positioning the Company as a potential cornerstone for North American cobalt and copper production Electra is also advancing black mass recycling opportunities to recover critical materials from endoflife batteries while continuing to evaluate growth opportunities in nickel refining and other downstream battery materials ContactHeather SmilesVice President Investor Relations amp Corporate Development Electra Battery MaterialsinfoElectraBMCcom14169003891 Neither the TSX Venture Exchange nor its Regulation Services Provider as that term is defined in policies of the TSX Venture Exchange accepts responsibility for the adequacy or accuracy of this release Cautionary Note Regarding ForwardLooking Statements This news release may contain forwardlooking statements and forwardlooking information together forwardlooking statements within the meaning of applicable securities laws All statements other than statements of historical facts are forwardlooking statements including statements regarding the approved construction budget and the expected sufficiency of such budget to fund remaining construction activities through mechanical completion the timing of and ability to achieve key project milestones including the award of major contracts site mobilization commissioning activities mechanical completion commercial production and rampup the expected timing for achieving targeted throughput rates and production volumes the estimated additional capital required to support commissioning rampup and initial working capital the ability to complete engineering studies and implement incremental capital investments and debottlenecking the availability of equipment reagents and other inputs the availability timing cost and continuity of feedstock supply expectations regarding commercial arrangements and counterparties including the Companys previously announced agreement with LG Energy Solution and the availability timing and receipt of financial support from governmental and other sources Generally forwardlooking statements can be identified by the use of terminology such as plans expects estimates intends anticipates believes or variations of such words or statements that certain actions events or results may could would might occur or be achieved Forwardlooking statements are based on certain assumptions and involve risks uncertainties and other factors that could cause actual results performance and opportunities to differ materially from those implied by such forwardlooking statements Forwardlooking statements are based on managements current expectations and assumptions including without limitation that the Company will be able to execute its construction plan substantially as contemplated that contractors suppliers and service providers will perform in accordance with their contractual commitments that required materials equipment and labour will be available on acceptable terms and within expected timeframes that no material changes to project scope cost estimates applicable laws or regulatory requirements will occur that the Company will obtain and maintain all required permits approvals and authorizations that sufficient liquidity will be available to meet the Companys project and operating requirements including any additional capital required for commissioning rampup and working capital that commissioning and rampup will proceed as expected and the facility will achieve planned operating performance product specifications and throughput and that commercial counterparties will perform in accordance with the terms of their arrangements Forwardlooking statements involve known and unknown risks uncertainties and other factors that may cause actual results performance or achievements to differ materially from those expressed or implied by such forwardlooking statements These risks and uncertainties include among others risks relating to construction execution and schedule including delays contractor performance supply chain constraints labour availability and unforeseen site or technical conditions risks relating to cost estimates and budget sufficiency including inflation changes in market pricing scope changes and foreign exchange risks relating to financing and liquidity including the timing and availability of grant or loan proceeds compliance with conditions and covenants and the Companys ability to obtain additional financing on acceptable terms risks relating to commissioning rampup and operational performance including the ability to achieve targeted throughput rates and product quality risks relating to feedstock availability logistics and pricing including those associated with sourcing and transporting cobaltbearing materials risks relating to commercial arrangements including counterparty performance and market demand for cobalt sulfate and risks relating to governmental policies approvals and support Factors that could cause actual results to differ materially from these forwardlooking statements are set forth in the management discussion and analysis and other disclosures of risk factors for Electra Battery Materials Corporation filed on SEDAR at wwwsedarpluscom and on EDGAR at wwwsecgov Although the Company believes that the information and assumptions used in preparing the forwardlooking statements are reasonable undue reliance should not be placed on these statements which only apply as of the date of this news release and no assurance can be given that such events will occur in the disclosed timeframes or at all Except where required by applicable law the Company disclaims any intention or obligation to update or revise any forwardlooking statement whether as a result of new information future events or otherwise

Hudbay Delivers Record Fourth Quarter and Full Year 2025 Results; Achieves 2025 Consolidated Copper and Gold Production and Cost Guidance
TORONTO Feb 20 2026 GLOBE NEWSWIRE Hudbay Minerals Inc Hudbay or the Company TSX NYSE HBMtoday released its fourth quarter and full year 2025 financial results and announced 2026 annual production and cost guidance All amounts are in US dollars unless otherwise noted 2025 was a transformative year for Hudbay as we delivered record annual revenue of 22 billion and exceeded 1 billion in adjusted EBITDA underpinned by our 11th consecutive year of meeting consolidated copper production guidance said Peter Kukielski President and Chief Executive Officer Our diversified operating platform demonstrated exceptional resilience overcoming external challenges in Manitoba and Peru to generate over 380 million in free cash flow and achieving a third consecutive year of record financial performance The fourth quarter underscored our commitment to operational excellence We saw standout performance in Peru driven by highgrade Pampacancha ore record throughput at the New Britannia mill in Manitoba and the successful completion of the SAG mill feed system in British Columbia We are particularly proud to have met our primary production targets for copper and gold while significantly outperforming our twiceimproved cost guidance Our prudent strategic financial planning and execution has enabled us to achieve our balance sheet deleveraging goals and lower our cost of capital We now have the financial flexibility to sanction Copper World in 2026 embark on generational investments in our operating portfolio and commence increases in shareholder returns with our firstever dividend increase as part of our holistic capital allocation framework This will allow us to continue to deliver attractive growth and maximize longterm riskadjusted returns for our stakeholders Delivered Record Annual Revenue and Adjusted EBITDA Achieved 2025 Consolidated Copper and Gold Production and Cost Guidance Achieved record annual revenue of 22 billion and record annual adjusted EBITDAi of 11 billion in 2025 demonstrating the resilience and strength of Hudbays diversified operating platformAchieved full year consolidated copper and gold production guidance with 118188 tonnes of copper and 267934 ounces of gold despite mandatory wildfire evacuations in Manitoba and temporary operational interruptions in Peru resulting in production deferrals during the year2025 represents the 11th consecutive year in which Hudbay achieved its annual consolidated copper production guidance since Constancia declared commercial production and the 5th consecutive year achieving its annual consolidated gold production guidance since establishing standalone gold production guidancevSignificantly outperformed the twiceimproved 2025 consolidated cash cost guidance driven by strong cost control higher metal prices and meaningful exposure to gold byproduct credits resulting in consolidated cash costi and sustaining cash costi net of byproduct credits of 022 and 130 per pound of copper respectively in 2025 an improvement of 148 and 20 respectively compared to 2024Peru operations produced 85155 tonnes of copper and 74480 ounces of gold in 2025 with full year copper production within the 2025 guidance range while gold production far exceeded the top end of the annual guidance range This production output was attributable to the optimization of the mine plan in 2025 by prioritizing Pampacancha mining activities and fully depleting the highgrade satellite deposit in December Peru also leveraged the use of stockpiled ore during the third quarter of 2025 as the Company adapted its mine plan due to the social unrest experienced in the region Peru full year cash costi of 108 per pound of copper outperformed the low end of the 2025 annual guidance range of 135 to 165 per pound as a result of stable operating cost performance and higher byproduct creditsManitoba operations produced 173453 ounces of gold 9249 tonnes of copper 17646 tonnes of zinc and 800198 ounces of silver in 2025 Production was below the low end of the guidance range for gold and zinc while copper and silver production was within the guidance range in 2025 These production levels were achieved despite the impacts of over two months of production deferrals due to wildfire evacuations rampup activities throughout the summer and unexpected downtime from an eightday weatherrelated power outage in October In addition zinc production was lower than the guidance range as gold production was prioritized in Manitoba Manitoba full year cash costi of 549 per ounce of gold outperformed the low end of the 2025 annual guidance range of 650 to 850 per ounce as a result of productivity gains and lower treatment and refining chargesBritish Columbia operations produced 23784 tonnes of copper 20001 ounces of gold and 252811 ounces of silver in 2025 Copper production was below the low end of the production guidance range while the operations achieved full year 2025 production guidance for gold and silver Copper production in 2025 was impacted by reduced throughput at the primary semiautogenous grinding SAG mill in the fourth quarter of 2025 and a higher portion of lowgrade stockpiles utilized as ore feed in 2025 British Columbia full year cash costi of 306 per pound of copper achieved the 2025 annual cost guidance range of 245 to 345 per pound Delivered Strong Fourth Quarter Financial Results Driven by Resilient Operating Performance Achieved record quarterly revenue of 7329 million and record quarterly adjusted EBITDAi of 3859 million in the fourth quarter of 2025Demonstrated strong operational performance in the fourth quarter of 2025 as operations normalized after temporary production interruptions in the third quarter with consolidated copper production of 33069 tonnes and consolidated gold production of 84298 ouncesMaintained industryleading cost performance in the fourth quarter with consolidated cash costi and sustaining cash costi per pound of copper produced net of byproduct credits of 063 and 094 respectivelyPeru operations had the strongest quarter of the year in the fourth quarter with production of 25038 tonnes of copper 32865 ounces of gold and 731017 ounces of silver as strong copper and gold grades were mined from Pampacancha and less ore was processed from lowgrade stockpiles Hudbay continued to optimize the mine plan during the quarter with more ore mined from Pampacancha than previously expected resulting in the accelerated depletion of Pampacancha in late December compared to early 2026 Peru cash costi net of byproduct credits was 057 per pound of copper in the fourth quarter outperforming the low end of the annual cost guidance rangeManitoba operations produced 47423 ounces of gold in the fourth quarter slightly lower than quarterly cadence expectations due to unplanned down time in October from an eightday weatherrelated power outage offset by record monthly throughput at the New Britannia mill in December Manitoba operations also produced 3326 tonnes of copper 5703 tonnes of zinc and 214493 ounces of silver in the fourth quarter Manitoba cash costi net of byproduct credits was 705 per ounce of gold in the fourth quarter well within the annual cost guidance rangeBritish Columbia operations produced 4705 tonnes of copper 4010 ounces of gold and 57475 ounces of silver in the fourth quarter While the operations completed construction of the permanent feed system for the new second SAG mill in December total throughput in the fourth quarter was constrained by the primary SAG mill requiring unplanned maintenance early in the fourth quarter of 2025 British Columbia cash costi net of byproduct credits was 482 per pound of copper in the fourth quarter reflecting the production impacts from the primary SAG mill maintenanceFourth quarter net earnings attributable to owners and earnings per share attributable to owners were 1280 million and 032 respectively reflecting the strong gross margins as a result of higher metal prices and a 250 million business interruption insurance recovery related to the mandatory wildfire evacuations in Manitoba during the year After adjusting for the insurance recovery and other noncash items fourth quarter adjusted earningsi per share attributable to owners was 022The strong gross margins achieved in the fourth quarter of 2025 resulted in higher employee profit sharing expenses of 361 million recorded within cost of sales Achieved Deleveraging Targets Ahead of Schedule Hudbays unique copper and gold diversification across its operations provides exposure to higher copper and gold prices which together with a focus on cost control across the business continues to expand margins and generate attractive free cash flowWhile the majority of Hudbays revenue continue to be derived from copper production revenue from gold production continues to represent a growing portion of total revenues at 38 of total revenue in 2025 including 41 of revenue in the fourth quarter compared to 35 in 2024Delivered another quarter of record free cash flowi generation with 2282 million achieved during the fourth quarter of 2025 resulting in 3879 million in free cash flow in 2025Achieved adjusted EBITDAi of 3859 million in the fourth quarter of 2025 resulting in record annual adjusted EBITDAi of 10609 millionRepurchased and retired an additional 393 million of senior unsecured notes through open market purchases at a discount to par during the fourth quarter of 2025 reducing total debt to 10 billion as of December 31 2025 Since the end of 2024 Hudbay has reduced its longterm debt by 1851 millionNet debti decreased by 860 million to 4397 million as at December 31 2025 compared to 5257 million at December 31 2024Net debt to adjusted EBITDA ratioi was 04x at the end of the fourth quarter of 2025 a further improvement from 06x at the end of the fourth quarter of 2024After giving effect to the recent closing of the Copper World joint venture transaction which occurred in January 2026 Hudbays postclosing adjusted cash and cash equivalents as at December 31 2025 were approximately 992 millionii In addition Hudbay had undrawn availability of 4248 million under its revolving credit facilities as of December 31 2025 increasing its total postclosing adjusted liquidity to over 14 billionii Implementing Holistic Capital Allocation Framework to Maintain Strong Financial Discipline Deliver Growth Initiatives and Maximize Longterm Riskadjusted Returns Enhanced Capital Allocation Framework embedded into Hudbays annual financial planning cycle to provide a holistic approach to capital allocation decisions including capital deployment into brownfield projects greenfield projects strategic investments and exploration while considering debt repurchases share buybacks and dividendsHudbays recent financial transformation has positioned the Company to introduce a new quarterly dividend of C001 per share an annual increase of 100 compared to the former semiannual C001 per share dividend representing the Companys first dividend increase in its historyClosed the accretive 600 million joint venture transaction with Mitsubishi Corporation Mitsubishi in January 2026 securing a premier longterm 30 strategic partner for the development of Copper World Definitive feasibility study on track for completion in mid2026 with a sanctioning decision expected in 2026Ongoing optimization efforts at Copper Mountain include executing an accelerated stripping campaign to deliver higher grades starting in 2027 and mill improvement initiatives to achieve the permitted mill throughput capacity of 50000 tonnes per day in the second half of 2026Expected to deliver higher mill throughput rates at Constancia in the second half of 2026 with the installation of pebble crushersContinued large Snow Lake exploration program to further increase nearterm production and mineral reserves test regional satellite deposits for additional mill feed to utilize available capacity at Stall and explore the large land package for a new anchor deposit to meaningfully extend mine lifeUnderground infrastructure established at the 1901 deposit to enable exploration drilling throughout 2026 and prepare for full production by the end of 2027Drilling activities have increased at the coppergoldzinc Talbot deposit near Snow Lake with six drill rigs deployed and several stepout drill holes indicating resource expansion potentialEngineering work advances on the Flin Flon tailings reprocessing opportunity to assess the economic viability of producing critical minerals and precious metals and the potential to reduce the overall environmental footprintAdvancing plans to initiate a prefeasibility study for the Mason copper project in Nevada 2026 Guidance Reflects Stable Copper and Gold Production at Industryleading Margins Consolidated copper production of 124000 tonnes based on the midpoint of the 2026 guidance range is expected to increase by 5 compared to 2025 levels reflecting higher expected production in British Columbia with the anticipated mill throughput rampup to the targeted 50000 tonnes per day in the second half of 2026 partially offset by lower grades in Peru with the depletion of Pampacancha in 2025Consolidated gold production of 244500 ounces based on the midpoint of the 2026 guidance range is expected to be lower than 2025 production reflecting the depletion of Pampacancha in 2025 but higher in unstreamed gold ounces with higher gold production in Manitoba from mill throughput at New Britannia continuing to exceed expectationsConsolidated cash costi net of byproduct credits in 2026 is expected to be within 030 to 010 per pound of copper benefiting from higher gold production and a continued focus on maintaining stable operating costs across the business driving industryleading marginsTotal sustaining capital expenditures are expected to be 435 million in 2026 reflecting approximately 38 million in deferrals from 2025 and 44 million in onetime sustaining capital projects at the operationsAs the Company embarks on generational reinvestments total growth capital expenditures at the operations are expected to be 140 million in 2026 including approximately 23 million in deferrals from 2025 to advance several highreturn growth projects in 2026 to deliver increased copper exposure including Peru mill throughput enhancement projects early works at the New Ingerbelle expansion project in British Columbia and excludes growth capital related to the Copper World joint ventureGrowth capital expenditures at Copper World are expected to be 135 million in 2026 for project feasibility derisking and presanctioning costs which have been fully funded by the proceeds received from Mitsubishi as part of the closing of the Copper World joint venture transaction in January 2026 and include approximately 60 million for accelerated long lead items and derisking activities and 35 million of capital deferrals from 2025 Summary of Fourth Quarter Results Hudbays diversified asset portfolio delivered consolidated copper production of 33069 tonnes and consolidated gold production of 84298 ounces in the fourth quarter of 2025 Consolidated copper and gold production was higher than the third quarter of 2025 due to strong copper and gold grades from Pampacancha and less ore processed from lowgrade stockpiles compared to the third quarter Consolidated gold production also benefitted from the ramp up to full operations in Snow Lake after the mandatory wildfire evacuations were lifted in the third quarter of 2025 and record monthly throughput at the New Britannia mill in December Consolidated silver production of 1002985 ounces and zinc production of 5703 tonnes in the fourth quarter of 2025 were also higher than the third quarter of 2025 for the aforementioned reasons Cash generated from operating activities of 2094 million increased compared to the third quarter of 2025 as a result of higher gross margins driven by strong metal prices and higher sales volumes compared to the third quarter which was impacted by mandatory wildfire evacuations in Manitoba and a temporary operational interruption in Peru Operating cash flow before change in noncash working capital was 3369 million during the fourth quarter of 2025 reflecting an increase of 2666 million from the third quarter of 2025 This significant increase reflects higher copper and gold sales volumes from normalized operations after temporary interruptions and higher metal prices Adjusted EBITDAi was 3859 million in the fourth quarter of 2025 an increase compared to 1426 million in the third quarter of 2025 as higher realized metal prices and higher copper and gold sales volumes resulted in strong gross margins during the quarter Net earnings attributable to owners was 1280 million or 032 per share in the fourth quarter of 2025 compared to 2224 million or 056 per share in the third quarter of 2025 The decrease in earnings compared to the third quarter is a result of a noncash aftertax gain of 2427 million from a full impairment reversal relating to Hudbays Copper World project that occurred in the prior quarter Adjusted net earnings attributable to ownersi and adjusted net earnings per share attributable to ownersi in the fourth quarter of 2025 were 860 million and 022 per share respectively after adjusting for various noncash items on a pretax basis including a 250 million business interruption insurance recovery related to the Manitoba mandatory wildfire evacuations during the year a 57 million marktomarket revaluation gain on various instruments such as investments and sharebased compensation and a noncash 54 million foreign exchange gain among other items This increased compared to adjusted net earnings per share attributable to ownersi of 101 million and 003 per share in the third quarter of 2025 is a result of higher realized metal prices and higher sales volumes Consolidated cash costi net of byproduct credits was 063 per pound of copper in the fourth quarter of 2025 compared to 042 per pound in the third quarter of 2025 as Hudbay continued to demonstrate strong cost control across its operations The decrease in cash cost from the third quarter was a result of higher byproduct credits reflecting the benefits of the Companys diversified asset portfolio with higher realized prices across all metals Consolidated sustaining cash costi net of byproduct credits was 094 per pound of copper in the fourth quarter of 2025 which decreased compared to 209 per pound in the third quarter of 2025 due to the same factors impacting consolidated cash cost partially offset by planned higher cash sustaining capital expenditures Consolidated allin sustaining cash costi net of byproduct credits was 143 per pound of copper in the fourth quarter of 2025 lower than the third quarter of 2025 mainly due to the same reasons impacting consolidated cash cost and sustaining cash cost partially offset by higher corporate general and administrative GampA costs from the revaluation of Hudbays stockbased compensation due to a higher share price As at December 31 2025 total liquidity was 9937 million including 5689 million in cash and cash equivalents and undrawn availability of 4248 million under Hudbays revolving credit facilities Net debti at the end of the fourth quarter was 4397 million marking an 860 million improvement from the fourth quarter of 2024 as a result of deleveraging activities which included the repurchase and retirement of senior unsecured notes After giving effect to the closing of the Copper World joint venture transaction postclosing cash and cash equivalents as of December 31 2025 are approximately 992 millionii total postclosing adjusted liquidity increases to over 14 billionii and postclosing net debti is approximately zero Summary of Full Year Results Hudbay achieved 2025 consolidated production guidance for copper and gold with full year production of 118188 tonnes of copper and 267934 ounces of gold In 2025 the operations also produced 17646 tonnes of zinc 3468143 ounces of silver and 1282 tonnes of molybdenum 2025 represents the 11th consecutive year in which Hudbay achieved its annual consolidated copper production guidance since Constancia declared commercial production and 5th consecutive year achieving its annual consolidated gold production guidance since establishing standalone gold production guidancev With respect to Hudbays operating business units Peru exceeded the top end of the gold production guidance and achieved the guidance ranges for copper despite the impact from the temporary operational interruption due to social unrest While Hudbay was previously tracking within the guidance ranges in Manitoba despite the wildfires gold and zinc production fell below the low end of the respective ranges as a result of an eightday weatherrelated power outage in October Manitoba achieved guidance for copper and silver production despite these interruptions British Columbia achieved guidance for gold and silver production while copper production fell below the low end of the guidance range primarily due to unplanned maintenance at the primary SAG mill in the fourth quarter and a higher portion of lowgrade stockpiles utilized as ore feed in 2025 Cash generated from operating activities increased to 7073 million in 2025 from 6662 million in 2024 Operating cash flow before change in noncash working capital increased to a record 7643 million in 2025 from 6911 million in 2024 The increase in operating cash flow before changes in working capital was primarily the result of higher gross margins driven by higher metal prices and stable cost performance despite temporary operational interruptions during the year This was partially offset by a significant increase in cash taxes paid of 2684 million compared to 1325 million in 2024 reflecting earlier periods of high taxable income mainly at the Peru and Manitoba operations Adjusted EBITDAi was 10609 million in 2025 a 29 increase compared to 8225 million in 2024 achieving a new annual record The increase was the result of higher realized metal prices and stable operating performance driving strong cost control across the business Net earnings attributable to owners were 5685 million or 144 per share in 2025 compared to 767 million or 020 per share in 2024 Net earnings were positively impacted by higher realized prices for all metals and a noncash charge of 2427 million relating to an impairment reversal with respect to the Copper World project in 2025 partially offset by higher mining and income tax expenses Adjusted net earnings attributable to ownersi and adjusted net earnings per share attributable to ownersi in 2025 were 2655 million and 067 per share respectively after adjusting for items on a pretax basis such as a 3223 million impairment reversal with respect to the Copper World project 250 million in business interruption insurance recovery related to the Manitoba wildfires 186 million in foreign exchange gains and 149 million in consideration received from sale of a noncore project among other items This compares to adjusted net earnings attributable to ownersi and net earnings per share attributable to ownersi of 1814 million and 048 per share in 2024 Consolidated cash costi net of byproduct credits was 022 per pound of copper compared to 046 per pound in 2024 Hudbay significantly outperformed its twiceimproved 2025 consolidated cash cost guidance as a result of higher metal prices with a significant increase in gold byproduct credits partially offset by higher GampA due to higher employee profit sharing in Peru and Manitoba Consolidated sustaining cash costi net of byproduct credits of 130 per pound of copper in 2025 decreased from 162 per pound in 2024 due to the same reasons affecting cash cost partially offset by higher cash sustaining capital expenditures Hudbay outperformed the improved 2025 consolidated sustaining cash cost guidance as a result of the same reasons driving the outperformance on cash cost guidance Consolidated allin sustaining cash costi net of byproduct credits was 174 per pound of copper in 2025 lower than 188 per pound in 2024 as a result of the same reasons outlined above partially offset by higher corporate selling and administrative costs primarily due to a revaluation of sharebased compensation associated with a higher share price Consolidated Financial Conditionin millions except net debt to adjusted EBITDA ratioDec 31 2025Sep 30 2025Dec 31 2024Cash and cash equivalents and shortterm investments568961115818Total longterm debt100861047011075Net debt1439743595257Working capital26563475113Total assets622335916854876Equity attributable to owners of the Company323103080525532Net debt to adjusted EBITDA1040506 1 Net debt and net debt to adjusted EBITDA are nonGAAP financial performance measures with no standardized definition under IFRS For further information please see the NonGAAP Financial Performance Measures section of this news release 2 Working capital is determined as total current assets less total current liabilities as defined under IFRS and disclosed on the consolidated financial statements Working capital as of December 31 2025 was impacted by an increase in the current portion of longterm debt of 4721 million as the 2026 Notes are now maturing within one year Consolidated Financial PerformanceThree Months EndedYear Endedin millionsDec 31 2025Sep 30 2025Dec 31 2024Dec 31 2025Dec 31 2024Revenue7329346858492211020212Cost of sales4628281540051467814674Earnings before tax25713305103791202516Net earnings128022241935643678Net earnings attributable to owners128022242125685767Basic and diluted attributable earnings per share032056005144020Adjusted earnings attributable per share1022003018067048Operating cash flow before change in noncash working capital3369703231576436911Adjusted EBITDA1385914262573106098225Free cash flow12282152149038793680 1Adjusted earnings attributable per share adjusted EBITDA and free cash flow are nonGAAP financial performance measures with no standardized definition under IFRS For further information please see the NonGAAP Financial Performance Measures section of this news release Consolidated Production and Cost PerformanceThree Months EndedYear EndedDec 312025Sep 30 2025Dec 31 2024Dec 31 2025Dec 31 2024Contained metal in concentrate and dor produced1Coppertonnes330692420543262118188137943Goldounces842985358194161267934332240Silverounces1002985730394131165834681433983851Zinctonnes570354883851764633339Molybdenumtonnes32518519512821323Payable metal soldCoppertonnes341321828037927114534125094Gold2ounces844243827992734260261335342Silver2ounces871006418418115051831905523549816Zinctonnes3972345252611515225120Molybdenumtonnes19026918213341287Consolidated cash cost per pound of copper produced3Cash costlb063042045022046Sustaining cash costlb094209137130162Allin sustaining cash costlb143278153174188 1 Metal reported in concentrate is prior to deductions associated with smelter contract terms 2 Includes total payable gold and silver in concentrate and in dor sold and other secondary products 3 Cash cost sustaining cash cost and allin sustaining cash cost per pound of copper produced net of byproduct credits are nonGAAP financial performance measures with no standardized definition under IFRS For further information please see the NonGAAP Financial Performance Measures section of this news release Peru Operations Review Peru OperationsThree Months EndedYear EndedDec 31 2025Sep 30 2025Dec 31 2024Dec 31 2025Dec 31 2024Constancia ore mined1tonnes561091556457941860582153908915046190Copper031025040031034Goldgtonne003002004003004Silvergtonne327192388318308Molybdenum001001002002001Pampacancha ore mined1tonnes41520004260081403726495634429317499Copper043038063040055Goldgtonne027031038029032Silvergtonne484487643478561Molybdenum001001000001001Total ore minedtonnes9762915482466082233223110253124363689Strip ratio2057138122104178Ore milledtonnes7627853699174479994533029266831933624Copper039031048033036Goldgtonne018016020011014Silvergtonne419394528372384Molybdenum001001001001001Copper recovery845832878843850Gold recovery747721733692707Silver recovery711652714667688Molybdenum recovery388339371374417Contained metal in concentrateCoppertonnes2503818114339888515599001Goldounces3286526380380797448098226Silverounces73101757744696950224151342708262Molybdenumtonnes32518519512821323Payable metal soldCoppertonnes2836111769287758443888138Goldounces3787497983745971755103364Silverounces65038425821582461322398322343820Molybdenumtonnes19026918213341287Combined unit operating cost345tonne14511303152513021291Cash cost46lb057130100108118Sustaining cash cost4lb153211148202186 1 Reported tonnes and grade for ore mined are estimates based on mine plan assumptions and may not reconcile fully to ore milled2 Strip ratio is calculated as waste mined divided by ore mined3 Reflects combined mine mill and GampA costs per tonne of ore milled Reflects the deduction of expected capitalized stripping costs4 Combined unit operating cost cash cost and sustaining cash cost per pound of copper produced net of byproduct credits are nonGAAP financial performance measures with no standardized definition under IFRS For further information please see the NonGAAP Financial Performance Measures section of this news release5 Excludes approximately 13 million or 017 per tonne of overhead costs incurred during temporary suspension during the three months ended December 31 2025 73 million or 104 per tonne during the three months ended September 30 2025 and 86 million or 028 per tonne during the year ended December 31 20256 Excludes approximately 13 million or 002 per pound of overhead costs incurred during temporary suspension during the three months ended December 31 2025 73 million or 019 per pound during the three months ended September 30 2025 and 86 million or 005 per pound during year ended December 31 2025 Peru operations had its strongest quarter of the year in the fourth quarter with continued strong copper and gold grades from Pampacancha and less ore processed from lowgrade stockpiles compared to the third quarter of 2025 The Company continued to optimize the mine plan in the fourth quarter with more ore mined from Pampacancha than previously expected resulting in the accelerated depletion of Pampacancha in late December as opposed to early 2026 and enabling Hudbay to exceed the top end of the 2025 Peru gold guidance range During the fourth quarter of 2025 the Peru operations produced 25038 tonnes of copper 32865 ounces of gold 731017 ounces of silver and 325 tonnes of molybdenum Production of copper gold and silver increased by 38 25 and 27 respectively compared to the third quarter of 2025 Production of all metals was higher primarily due to higher ore milled as the third quarter was impacted by a temporary operational interruption due to social unrest Hudbay temporarily suspended Constancia operations from September 22nd to October 3rd as a result of illegal protests at the mine and as a precaution to ensure the safety of personnel and community members Production of molybdenum was higher in the fourth quarter of 2025 due to higher recoveries and additional tonnes of ore milled in the molybdenum plant Despite the impacts from social unrest in the third quarter Hudbay achieved its 2025 production guidance for copper and gold in Peru with gold production exceeding the top end of the 2025 guidance range by 24 Production of silver and molybdenum fell slightly short of the lower end of guidance Full year 2025 production of copper gold silver and molybdenum was 85155 tonnes 74480 ounces 2415134 ounces and 1282 tonnes respectively representing a decrease of 14 24 11 and 3 respectively from the comparative 2024 period primarily due to fewer tonnes of ore milled in the current period due to the aforementioned temporary operational interruption in the third quarter of 2025 and lower grades from higher amounts of ore processed from stockpile Total ore mined in the fourth quarter was 102 higher than the third quarter of 2025 a sizable increase due to the impacts from social unrest during the third quarter Mining activities in the Pampacancha pit were completed during the fourth quarter and the remaining stockpiled Pampacancha ore was fully processed during January 2026 Total mill throughput increased to 76 million tonnes during the fourth quarter of 2025 higher than the third quarter of 2025 due to higher mechanical availability as the prior quarter was impacted by the temporary operational interruption due to social unrest partially offset by a scheduled semiannual mill maintenance shutdown in the fourth quarter of 2025 Milled copper grades increased by 26 compared to the third quarter 2025 primarily due to higher grades from Pampacancha and less ore processed from stockpiles Milled gold grades increased compared to the third quarter of 2025 due to a higher portion of ore feed from Pampacancha where the gold grades are meaningfully higher than at Constancia Copper recoveries of 85 in the fourth quarter of 2025 were higher compared to the third quarter of 2025 due to the different proportions of ore feed from stockpiles and pits Recoveries of gold and silver during the fourth quarter of 2025 were in line with Hudbays metallurgical models for the ore that was being processed The Company continues to advance the installation of pebble crushers in Peru to increase mill throughput rates starting in the second half of 2026 which will allow Constancia to deliver steady annual copper production despite lower grades from the depletion of Pampacancha Hudbays efforts to increase mill throughput align with the Peru Ministry of Energy and Mines regulatory change to allow mining companies to operate up to 10 above permitted levels Combined mine mill and GampA unit operating cost in the fourth quarter of 2025 was 1451 per tonne 11 higher than the third quarter of 2025 due to higher fuel consumption associated with additional tonnes of material moved higher water management and dewatering costs and higher milling costs associated with the scheduled semiannual mill maintenance program partially offset by additional tonnes milled Combined mine mill and GampA unit operating cost for the full year 2025 was 1302 per tonne which was consistent with 2024 Cash costi net of byproduct credits in the fourth quarter of 2025 was 057 per pound of copper a 56 decrease compared to the third quarter of 2025 as a result of higher gold byproduct credits partially offset by higher profit sharing Full year 2025 cash costi net of byproduct credits was 108 per pound of copper outperforming the low end of the Peru cash cost guidance range and representing a 8 improvement from 2024 due to lower treatment and refining charges and higher byproduct credits from gold partially offset by higher profit sharing and lower pounds of copper produced due to the impacts from social unrest in the third quarter Sustaining cash costi net of byproduct credits was 153 per pound of copper in the fourth quarter of 2025 a 27 decrease compared to the third quarter of 2025 due to higher gold byproduct credits partially offset by higher capital spending as a result of timing of sustaining capitalized expenditures higher community payments and increased lease payments Full year 2025 sustaining cash costi net of byproducts credits was 202 per pound copper higher than 186 per pound in 2024 due to lower grade higher planned mine maintenance higher lease payments and higher payments to communities This was partially offset by lower treatment and refining charges and higher byproduct credits from gold Fourth quarter copper gold and silver metal sold was higher than the third quarter of 2025 primarily due to the shifting of copper concentrate sales at the end of the third quarter into early in the fourth quarter as a result of ocean swells at the port in late September While copper concentrate inventory levels normalized at the end of December 2025 the concentrate contained higher levels of precious metals due to a higher portion of Pampacancha production in the second half of the year resulting in a shift of some precious metals sales from December 2025 to January 2026 Manitoba Operations Review Manitoba OperationsThree Months EndedYear EndedDec 31 2025Sep 30 2025Dec 31 2024Dec 31 2025Dec 31 2024LalorOre minedtonnes35381913900642245411801211626935Goldgtonne551542461535468Copper082067095079085Zinc255193295241284Silvergtonne29523157319130432714New BritanniaOre milledtonnes17980892765185592624631715198Goldgtonne668688599687629Copper108076117095104Zinc130100108109099Silvergtonne31173218339731752778Gold recovery1886918902898897Copper recovery886900913892936Silver recovery1771785796790809Stall ConcentratorOre milledtonnes16927443940222004572704893510Goldgtonne324310336345342Copper069056073067071Zinc432361462390433Silvergtonne24973104299028312654Gold recovery713726696701686Copper recovery865834844867874Zinc recovery780346817790862Silver recovery556503551554568Total contained metal in concentrate and dor2Goldounces474232244151438173453214225Coppertonnes33268423347924912536Zinctonnes570354883851764633339Silverounces214493102132283223800198995090Total payable metal soldGoldounces432262311850239169041212243Coppertonnes20247693321765111602Zinctonnes3972345252611515225120Silverounces175324112142282158729314956460Combined unit operating cost345Ctonne248258233236226Gold cash cost46oz705379607549606Gold sustaining cash cost4oz1110762908875868 1 Gold and silver recovery includes total recovery from concentrate and dor 2 Total metal reported in concentrate is prior to deductions associated with smelter terms and includes other secondary products Dor includes sludge slag and carbon fines 3 Reflects combined mine mill and GampA costs per tonne of ore milled 4 Combined unit operating cost cash cost and sustaining cash cost per ounce of gold produced net of byproduct credits are nonGAAP financial performance measures with no standardized definition under IFRS For further information please see the NonGAAP Financial Performance Measures section of this news release 5 Excludes overhead costs of 160 million or C163 per tonne during the three months ended September 30 2025 and 192 million or C22 per tonne during the year ended December 31 2025 6 Excludes overhead costs of 160 million or 713 per ounce during the three months ended September 30 2025 and 192 million or 111 per ounce during the yearended December 31 2025 Manitoba operations normalized in the fourth quarter of 2025 following the significant wildfire disruptions in the second and third quarters of 2025 allowing the Company to achieve quarterly production numbers similar to what were demonstrated earlier in the year The Manitoba operations produced 47423 ounces of gold 3326 tonnes of copper 5703 tonnes of zinc and 214493 ounces of silver in the fourth quarter of 2025 Production of all metals in the fourth quarter was higher than the third quarter of 2025 which was negatively impacted by mandatory wildfire evacuations Achievements in the fourth quarter included improved metal recovery rates advancements in Hudbays exploration programs in Flin Flon and Snow Lake including the prospective coppergoldzinc Talbot satellite deposit and the graduation of the second cohort from the mining fundamentals training program focused on providing local and Indigenous communities with valuable mining skills In 2025 Hudbay signed exploration agreements with the Mosakahiken Cree Nation and the Kiciwapa Cree Nation and achieved record throughput at the New Britannia mill in December All of this was underpinned by a continued focus on safety with a 15 reduction in total recordable injury frequency achieved in 2025 Production for the full year 2025 in Manitoba was lower than 2024 as a result of two months of production deferrals due to mandatory wildfire evacuations in 2025 an eightday weatherrelated power outage in October 2025 and the subsequent rampup period required to restore full operational cadence While the operations were tracking within all guidance ranges earlier in the year full year gold and zinc production fell below the low end of the respective ranges Despite the disruptions 2025 full year production in Manitoba successfully achieved guidance for copper and silver The Lalor mine focused on stabilizing production in the fourth quarter after the resumption of operations following the mandatory wildfire evacuations Lalor averaged over 4200 tonnes per operating day in the fourth quarter strategically prioritizing mining from gold zones to ensure prioritized feed for the New Britannia mill This was accomplished through a focus on mine planning and the maintenance recovery plan to get Lalors underground mobile fleet back to prewildfire availability numbers In the fourth quarter of 2025 gold grades increased by 2 compared to the third quarter of 2025 due to mining techniques resulting in improved ore quality and prioritizing mining gold zones at Lalor The 1901 deposit delivered 6600 tonnes of development ore in 2025 as the project progresses towards full production in 2027 During the year haulage and exploration drifts were prioritized as infrastructure was being put in place In 2026 activities at 1901 will prioritize exploration and definition drilling orebody access and establishing critical infrastructure ahead of full production in late 2027 The New Britannia mill processed approximately 2300 tonnes per day in December achieving a new monthly throughput record of 71504 tonnes This achievement is aligned with the strategy to prioritize gold ore production and resulted from continuous improvement efforts focused on unlocking capacity at designed or improved recovery rates Despite the wildfire challenges in 2025 New Britannia achieved its second highest annual throughput of 624631 tonnes as Lalor delivered production from the gold zones ensuring a consistent feed to the mill New Britannias gold recovery in the quarter was 89 reflecting a slight decrease compared to the third quarter of 2025 due to ore blend resulting in slightly lower gold grades processed at the mill The Stall mill continues to focus on process optimization and enhanced gold recovery initiatives targeting over 70 gold recovery from the base metal ore stream The Stall mill processed significantly less ore in 2025 compared to the same periods in 2024 which is aligned with the Companys strategy of allocating more Lalor ore feed to New Britannia as noted above The Stall mill achieved gold recoveries of 71 in the fourth quarter of 2025 reflecting benefits from process optimization and enhanced gold recovery initiatives Combined mine mill and GampA unit operating costsi in the fourth quarter and full year 2025 were C248 per tonne and C236 per tonne respectively relatively consistent with all comparable periods after adjusting for the allocation of fixed overheads in periods with lower capacity utilization due to the wildfires Cash costi net of byproduct credits was 705 per ounce of gold in the fourth quarter of 2025 higher than the third quarter of 2025 primarily due to higher overall costs and the impact of the recovery of secondary gold products in the third quarter as a result of mill tank cleanouts partially offset by higher production Full year 2025 cash costi net of byproduct credits was 549 per ounce of gold a 9 decrease compared to the same period in 2024 primarily due to lower operating costs partially offset by lower gold production and higher profit sharing This strong cost performance was supported by the strategic decision to prioritize highmargin gold production over byproduct zinc production Despite the production headwinds cash cost for the full year 2025 outperformed the low end of the guidance range Sustaining cash costi net of byproduct credits was 1110 per ounce gold in the fourth quarter of 2025 higher than the third quarter of 2025 primarily due to the same factors affecting cash costs and elevated capital sustaining capital expenditures Full year 2025 sustaining cash costi net of byproduct credits was 875 per ounce of gold a slight increase from 2024 primarily due to the same factors affecting cash cost noted above with slightly higher capital expenditures Manitoba sales volumes in the fourth quarter of 2025 reflect a rebuild of inventory levels as operations normalized after the wildfires in the second and third quarters of 2025 British Columbia Operations Review British Columbia Operations5Three Months EndedYear Ended5Dec 31 2025Sep 302025Dec 312024Dec 312025Dec 312024Ore mined1tonnes239516618156892374044936891811360125Strip ratio2718884736746598Ore milledtonnes2268405308744328809271101684212656679Copper026022026027025Goldgtonne009008009009008Silvergtonne110078092102096Copper recovery784766795786824Gold recovery633592558636605Silver recovery714655690697718Total contained metal in concentrateCoppertonnes4705524959272378426406Goldounces4010476046442000119789Silverounces574755081658933252811280499Total payable metal soldCoppertonnes3747574258312244525354Goldounces3324536350361946519735Silverounces452984806143747221406249536Combined unit operating cost34Ctonne39802502232228122039Cash cost4lb482321300306274Sustaining cash cost4lb887743576612529 1 Reported tonnes and grade for ore mined are estimates based on mine plan assumptions and may not reconcile fully to ore milled2 Strip ratio is calculated as waste mined divided by ore mined3 Reflects combined mine mill and GampA costs per tonne of ore milled Reflects the deduction of expected capitalized stripping costs4 Combined unit operating cost cash cost and sustaining cash cost per pound of copper produced net of byproduct credits are nonGAAP financial performance measures with no standardized definition under IFRS For further information please see the NonGAAP Financial Performance Measures section of this news release5 Copper Mountain mine results are stated at 100 On April 30 2025 Hudbay completed the acquisition of the remaining 25 interest in the Copper Mountain mine and now owns 100 Throughout 2025 Hudbay focused on advancing its multiyear optimization plan at Copper Mountain centered on ramping up mining activities and implementing standardized operating practices A key pillar of this rampup was the successful onboarding of over 240 new employees significantly expanding the Companys inhouse team of skilled equipment operators This strategic investment has led to a meaningful reduction in reliance on temporary contractor labour ensuring longterm operational stability During the fourth quarter of 2025 the British Columbia operations produced 4705 tonnes of copper 4010 ounces of gold and 57475 ounces of silver Metal production was lower compared to the third quarter of 2025 primarily reflecting reduced mill throughput caused by the unplanned maintenance on the primary SAG For the full year 2025 production of copper gold and silver was 23784 tonnes 20001 ounces and 252811 ounces respectively Annual copper and silver production were lower yearoveryear reflecting lower mill availability in the fourth quarter of 2025 and the strategic focus on waste stripping during the period Despite the throughput constraints encountered in the latter half of the year annual gold production increased by 1 compared to 2024 This growth was driven by higher head grades and improved gold recoveries resulting from the flotation circuit optimizations implemented throughout the year The British Columbia operations achieved 2025 production guidance for gold and silver while copper production fell below the low end of the 2025 guidance range due to the unplanned maintenance at the primary SAG mill in the fourth quarter and a higher than anticipated proportion of lower grade stockpile ore processed throughout the year Mining operations have focused on a threeyear accelerated stripping program to unlock higher grade ore starting in 2027 In the fourth quarter of 2025 this initiative was bolstered by an optimized mining sequence and enhanced maintenance driving mining rates to a targeted 300000 tonnes per day in December To sustain this momentum a new production loader was commissioned in January 2026 and a new shovel is currently scheduled for deployment in March 2026 Total ore mined at Copper Mountain in the fourth quarter of 2025 was 24 million tonnes an increase of 32 compared to the third quarter of 2025 During the quarter the mining team utilized planned ore stockpiles for mill feed and highergrade ore from an advanced phase in the main pit allowing the operation to prioritize waste stripping activities to expose highervalue mining fronts in the future The significant quarteroverquarter improvement reflects the optimization of the mining sequence which improved bench configurations and eliminated phase interference along with enhanced mobile equipment maintenance protocols leading to more consistent availability In the mill the permanent feeder configuration for the second SAG mill was commissioned late in the fourth quarter and the temporary conveyor system located on the ore live pile was removed in January 2026 With the completion of the permanent feeder for the second SAG mill project in December the second SAG mill continued to demonstrate positive contributions to overall throughput in the fourth quarter The mill processed 23 million tonnes of ore during the fourth quarter of 2025 a decrease of 27 compared to the third quarter of 2025 primarily as a result of unplanned maintenance on the primary SAG mill to address localized damage to the feed end head Operations were further constrained by elevated clay content in the ore feed and the planned decrease of the ore feed pile to accommodate the construction and tieins for the second SAG expansion project To mitigate these challenges and build longterm reliability the team implemented several initiatives in 2025 including crushing circuit chute modifications the installation of advanced grinding control instrumentation and a redesigned SAG liner package Despite throughput constraints milled copper grades during the fourth quarter of 2025 were 18 higher than the third quarter of 2025 driven by higher grades in ore mined Copper recoveries improved to 78 in the fourth quarter of 2025 supported by highergrade feed and ongoing flotation circuit refinements Gold recoveries of 63 saw a 7 increase over the third quarter as a result of general improvements in the flotation system While the primary SAG mill continues to operate under a reduced load it is being rigorously monitored ahead of a feed end head replacement in mid2026 In the first half of 2026 optimization efforts will focus on automated grinding media loading installing a mill slicer on the second SAG implementing advanced process control on grinding and flotation and a pebble circuit trial to improve overall throughput capacity The mill remains on track to achieve its permitted capacity of 50000 tonnes per day in the second half of 2026 with the permanent second SAG feeder configuration commissioned in December 2025 the removal of livepile restrictions in January the proactive primary SAG feed end head replacement in mid2026 and rollout of automated grinding media loading and advanced process controls Combined mine mill and GampA unit operating costsi were C3980 per tonne milled in the fourth quarter of 2025 This increase relative to the third quarter of 2025 was primarily due to lower milled throughput and nonrecurring costs associated with the unplanned primary SAG mill maintenance Additionally mining and administrative costs were higher in the fourth quarter as the operations transitioned towards an expanded inhouse workforce and continued to advance the accelerated stripping program For the full year 2025 unit operating costsi were C2812 per tonne compared to C2039 per tonne milled in the same period of 2024 reflecting the lower annual throughput and the strategic rampup of sitewide optimization initiatives Cash costi and sustaining cash costi net of byproduct credits were 482 and 887 per pound of copper respectively in the fourth quarter of 2025 Cash cost was higher than the third quarter of 2025 largely driven by the ramp up of mining activities in the fourth quarter to advance the accelerated stripping program combined with lower byproduct credits as a result of the primary SAG maintenance early in the fourth quarter Sustaining cash costs were higher than the third quarter of 2025 due to higher cash costs offset by lower capitalized stripping costs Despite the throughput and copper production headwinds in 2025 the British Columbia business unit demonstrated strong cost discipline Full year 2025 cash costi and sustaining cash costi net of byproduct credits were 306 and 612 per pound of copper respectively achieving the annual guidance range Following the quarter end the New Ingerbelle project reached a major milestone with the provincial regulators referring the permit application to Statutory Decision Makers on January 16 2026 New Ingerbelle permits are expected to be received in the first quarter of 2026 and the project is expected to further extend mine life at Copper Mountain Furthermore Hudbay finalized refreshed Participation Agreements with the Upper and Lower Similkameen Indian Bands in February 2026 reinforcing the Companys commitment to strong Indigenous partnerships Continued Free Cash Flow Generation Driving Further Debt Reduction and Significant Financial Flexibility Hudbay has delivered several quarters of meaningful free cash flow generation as a result of steady operating performance expanding margins from strong copper and gold exposure and a focus on cost control across the business This has resulted in Hudbay achieving record annual adjusted EBITDAi of 10609 million and record annual free cash flowi of 3879 million in 2025 As a result of the strong operating and financial performance Hudbay continued its prudent balance sheet management and further reduced overall debt levels in the fourth quarter of 2025 resulting in a total of 1025 million in debt repayments during the full year 2025 These deleveraging efforts have reduced total principal debt to 10086 million as of December 31 2025 As of December 31 2025 Hudbay had approximately 569 million in cash and cash equivalents resulting in a reduction in net debt to 4397 million compared to 5257 million at December 31 2024 Similarly Hudbay reduced its net debt to adjusted EBITDA ratio to 04x at the end of the fourth quarter of 2025 a further improvement from 06x at the end of fourth quarter of 2024 After giving effect to the closing of the Copper World joint venture transaction as described below Hudbays postclosing adjusted cash and cash equivalents as at December 31 2025 was approximately 992 millionii In addition Hudbay had undrawn availability of 425 million under Hudbays revolving credit facilities as of December 31 2025 increasing total postclosing adjusted liquidity to over 14 billionii Hudbay is wellpositioned to advance Copper World and fund its several other highreturn growth opportunities across the business Prudently Advancing Copper World Towards a Sanction Decision in 2026 In January 2026 Hudbay announced the closing of the joint venture transaction JV Transaction with Mitsubishi securing a premier longterm strategic partner for the development of Copper World The Company continues to progress the detailed engineering work to derisk Copper World ahead of a sanction decision later this year Realized Accretive JV Transaction On January 12 2026 Hudbay announced the closing of the highly accretive 600 million JV Transaction which represents a significant derisking milestone in advancing Copper World and further validates the premium longterm value of this worldclass asset The 420 million of proceeds received at closing from Mitsubishi will be used to directly fund the remaining definitive feasibility study DFS costs and presanctioning costs in addition to the initial project development costs for Copper World Mitsubishi will contribute an additional 180 million within 18 months of closing to complete its 30 minority investment and will also fund its prorata 30 share of future equity capital contributions The JV Transaction increases the project IRR to Hudbay to approximately 90 based on prefeasibility study PFS estimatesiiiSecured Premier Strategic Joint Venture Partner Mitsubishi is one of the largest Japanese trading houses with a global mining presence and a significant USbased business Mitsubishi is the partner of choice with investments in a worldclass portfolio of large and highquality copper assets including five of the top twenty copper mines globally by 2024 production This partnership validates the attractive longterm value of Copper World as a worldclass copper asset and endorses the strong technical capabilities of Hudbay It also represents the beginning of a longterm strategic partnership and the parties are identifying other opportunities for collaboration to advance their respective copper growth strategiesAchieved Key Elements of Hudbays Three Prerequisites 3P Plan Hudbay has achieved the final key elements of its prudent 3P financial strategy for the development of Copper World with the closing of the JV Transaction and the achievement of stated balance sheet targets After accounting for proceeds from the JV Transaction Hudbay has postclosing cash and cash equivalents of 992 millionii and reduced its postclosing net debt to adjusted EBITDA ratio to 00x far exceeding the stated balance sheet targets The Mitsubishi initial investment and its future prorata equity capital contributions together with the Wheaton Precious Metals Corp streamiv provide significant financial flexibility by reducing Hudbays estimated share of the remaining capital contributions to approximately 200 million based on PFS estimates and deferring Hudbays first capital contribution to 2028 at the earliestFeasibility Study and Detailed Engineering Underway Feasibility activities for Copper World are well underway with expected completion of the DFS in mid2026 Hudbay has continued to execute detailed engineering work and other derisking activities in preparation for a Copper World sanctioning decision expected in 2026 Manitoba Exploration Update Large Exploration Drill Program Continues in Snow Lake Hudbay continues to execute the largest exploration program in Snow Lake in the Companys history through extensive geophysical surveying and multiphased drilling campaigns as part of Hudbays threefold exploration strategy Nearmine Exploration at Lalor and 1901 to Further Increase Nearterm Production and Extend Mine Life Hudbay completed the development of the initial exploration drift at the 1901 deposit in 2025 and the development of the haulage drift is underway Hudbay received positive initial stepout drilling results from the exploration drift and during the second half of 2025 some zinc development ore was delivered for processing at Stall Activities at 1901 over the next two years will focus on exploration definition drilling orebody access and establishing critical infrastructure for full production in late 2027 Exploration activities at 1901 will target additional stepout drilling to potentially extend the orebody and infill drilling to convert inferred mineral resources in the gold lenses to mineral reservesTesting Regional Satellite Deposits to Utilize Available Processing Capacity and Increase Production Hudbay increased its regional land package by more than 250 in 2023 through the acquisition of Rockcliff Metals Corp Rockcliff which included the addition of several known deposits located within trucking distance of the Snow Lake processing infrastructure The deposits acquired as part of the Rockcliff acquisition together with several deposits already owned by Hudbay in Snow Lake have created an attractive portfolio of regional deposits in Snow Lake including the Talbot New Britannia Rail Pen II Watts 3 Zone and WIM deposits The continued strong performance from the New Britannia mill has freed up processing capacity at the Stall mill where there is approximately 1500 tonnes per day of available capacity which could be utilized by the regional satellite deposits to increase production and extend the life of the Snow Lake operations beyond 2037Exploring Large Land Package for a New Anchor Deposit to Significantly Extend Mine Life A majority of the land claims acquired as part of the Rockcliff acquisition have been untested by modern deep geophysics which was the discovery method for the Lalor deposit A large geophysics program is currently underway consisting of surface electromagnetic surveys using cutting edge techniques that enable the team to detect targets at depths of almost 1000 metres below surface The planned geophysics program is the largest geophysics program in Hudbays history and includes 800 kilometres of ground electromagnetic surveys and an extensive airborne geophysics survey Talbot Initial Drilling Results Confirm Resource Expansion Potential Talbot is a copperzincgold rich VMS deposit located within trucking distance to existing processing infrastructure in Snow Lake Successful drilling campaigns could expand the resource base and support a PFS to upgrade the mineral resources to reserves extending the overall mine life of the Snow Lake operations In April 2025 Hudbay announced the signing of the exploration agreement with the Mosakahiken Cree Nation on exploration activities in their traditional and ancestral territory including at Talbot In July 2025 Hudbay commenced an extensive summer drill program at Talbot focused on expanding the known mineralization at depth testing geophysical targets as well as conducting an infill drill program in the upper part of the ore body to support a PFS As part of the initial drilling program in 2025 Hudbay drilled six holes to test the continuity of the Talbot deposit at depth with all the holes yielding positive results and four of them returning mineralized intercepts with economic potential see table of intercepts below The 2026 drilling program has now commenced with six drill rigs deployed including one drill rig focused on continuing to expand the footprint of the deposit at depth In addition to the intercepts below another hole provided a significant intercept of copper mineralization over an estimated length of 197 metres from core logging and for which assay results are pending Hole IDFrommTomIntercept mEstimated true width m1Cu2Augt2Aggt2Zn2CuEq 34TLS024155601567511510424185510842TLS025 top143531449514213212081780520TLS025 bottom1459014650605620071690526TLS0261265512734787114091840322TLS027W02125281271518816314081891324 1 True widths are estimated based on drill angle and intercept geometry of mineralization 2 All copper gold silver and zinc values are uncut 3 Copperequivalent CuEq grade calculated using the following longterm commodity price assumptions 440 per pound copper 2800 per ounce gold 3200 per ounce silver and 125 per pound zinc 4 Using the combined recoveries of New Britannia and Stall mills of 89 copper 89 gold 81 silver and 84 zinc In 2026 the Company plans on progressing a PFS and preparing an updated mineral resource estimate for Talbot using Hudbay standard methods that have demonstrated high reserve conversion rates Expanded Flin Flon Exploration Partnership with Marubeni and JOGMEC On January 22 2026 the Company announced the signing of an amended and restated option agreement with Japan Organization for Metals and Energy Security JOGMEC and Marubeni Corporation Marubeni where Hudbay granted JOGMEC an option to acquire a 10 interest in three projects located within trucking distance of Hudbays processing facilities in Flin Flon Manitoba In order to exercise its option JOGMEC is required to fund at least C6 million in exploration expenditure over a period of approximately three years with Hudbay acting as the operator carrying out the exploration activities The agreement is an amendment and restatement of the option agreement with Marubeni from March 2024 pursuant to which Marubenis whollyowned Canadian subsidiary was granted an option to acquire a 20 interest in the three projects provided it funds at least C12 million in exploration expenditures over the designated earnin period which is inclusive of past contributions made by Marubeni since March 2024 The option agreement focuses on three projects in the Flin Flon region namely CuprusWhite Lake Westarm and North Star which were selected by Marubeni prior to the original March 2024 agreement and following a period of detailed due diligence All three properties hold past producing mines that generated meaningful production with attractive grades of both base metals and precious metals The properties remain highly prospective with potential for further discovery based on the attractive geological setting limited historical deep drilling and promising geochemical and geophysical targets CuprusWhite Lake Westarm and North Star are all within 20 kilometres of Hudbays Flin Flon milling complex Senior Management Team Appointments In January 2026 Hudbay appointed Audra Walsh to the role of Vice President South America Business Unit Ms Walsh joined Hudbay as acting Vice President in Peru in August 2025 and has transitioned to the permanent role as a testament to her exceptional talent as a professional engineer with over 30 years of technical operating management executive and board experience in the mining industry As leader of the South America Business Unit Ms Walsh is responsible for the strategic performance of Hudbays operational and exploration activities in Peru and exploration activities in Chile Ms Walshs leadership experience and deep expertise will be instrumental in helping Hudbay achieve regional milestones and drive growth in Peru with the longlife operations at Constancia the future development of Caballito and Maria Reyna and further regional exploration Holistic Capital Allocation Framework to Deliver Growth and Maximize LongTerm RiskAdjusted Returns Hudbay has a proven track record of prudently allocating capital to highreturn brownfield investments such as the New Britannia gold mill refurbishment project and the development of the highgrade Pampacancha satellite deposit which have delivered significant free cash flows and contributed to Companys deleveraging efforts Hudbay has completed a financial transformation over the past three years The Company has moved from being overleveraged and capital constrained to a preferred position where it can strategically allocate capital across the portfolio to maximize value and generate the highest riskadjusted returns creating longterm sustainable value for stakeholders Prudent strategic financial planning and execution of the Companys 3P plan has achieved the Companys balance sheet deleveraging goals and has lowered its cost of capital With its strongest balance sheet in more than a decade and peerleading credit metrics together with the strategic investment by Mitsubishi Hudbay is very well positioned to sanction the Copper World project and embark on generational investments in the Companys operating portfolio in 2026 These generational investments include allocating capital to highreturn brownfield projects at the Companys three operating mines and advance its worldclass development and exploration pipeline To provide transparency and continued financial discipline Hudbay has implemented an enhanced Capital Allocation Framework to provide a holistic approach around capital allocation decisions including with respect to the deployment of capital into the business through nearterm brownfield projects longerterm greenfield projects strategic investments and exploration while considering debt repurchases share buybacks and dividends Hudbays holistic Capital Allocation Framework is embedded into the Companys annual financial planning cycle and includes the following key elements Preserving Balance Sheet Strength Aligning with successful deleveraging efforts to maintaining net debt to adjusted EBITDA ratios of less than 10x throughout the investment and development cycle continuing to lower the Companys cost of capital and considering unique nondilutive sources of project funding availableStrategic Fit for Growth and Diversification Expanding and optimizing production and mine life from the existing asset base enhancing Hudbays strategic commodity exposure to copper and complementary gold targeting 400000 tonnes of annual copperequivalent production increasing longterm portfolio diversification across tier1 jurisdictions and aligning with the Companys sustainability goalsAccretive Across Key Financial Metrics Pursuing investment opportunities that are accretive to a mix of key financial performance metricsHudbays net present value per share copperequivalent mineral resources per share return on invested capital and cash flow yields as well as demonstrating robust internal rate of returns and project paybacks to maximize value and longterm sustainable returns for all stakeholdersRigorous Risk Assessment Considering riskadjusted returns based on projectspecific characteristics applying varying discount rates commodity price scenarios and sensitivity analysis as well as key qualitative risk considerationsAccountable Investment Governance Integrating detailed project reviews as part of the annual budgeting process and executing investment decisions subject to a formal internal tollgate process requiring Executive Committee and Board approval followed by comprehensive postproject reviews to drive continuous improvement Increased Annual Dividend Following Hudbays recent financial transformation and consistent with its Capital Allocation Framework the Company has commenced an increase in shareholder returns in the form of a quarterly dividend Hudbays Board of Directors approved the introduction of a new quarterly dividend of C001 per share as the Company has achieved certain financial milestones ahead of schedule and has significantly improved its financial position The new total annual dividend amount of C004 per share represents an increase of 100 or C002 per share over the previous annual dividend which was paid semiannually representing the first dividend increase in the Companys history A quarterly dividend of C001 per share was declared on February 19 2026 The dividend will be paid out on March 27 2026 to shareholders of record as of close of business on March 10 2026 Climate Change Initiatives Since inception of Hudbays climate change strategy in 2022 the Company continues to implement initiatives to reduce its greenhouse gas GHG footprint The Company strives to measure efficiency against key process drivers while recognizing the unique characteristics of each business unit such as fluctuating strip ratios in open pit mines and changing development profiles at underground mines In 2025 Hudbay updated its climate change targets with new 2030 GHG emissions reduction targets specific to each business unit and focused on areas where the Company believes it can achieve the biggest impact The Company has made significant progress towards achieving its climate change goals including Peru Hudbays new 10year power purchase agreement with ENGIE Energa Per for access to a 100 renewable energy supply to Constancia came into effect in January 2026 This is expected to be a key contributing factor towards the Peru operations reaching its 2030 target of a 99 reduction in Scope 2 GHG emissions intensity tonnes of Scope 2 emissions per kilotonne of ore processed compared to a 2022 baselineManitoba Hudbay continues to expand its fleet of electric equipment for use at its underground operations Following the successful initial trial of an electric Epiroc scooptram ST14 SG at the Lalor mine in 2023 the Company has seen reduced carbon intensity and improved ventilation due to temperature reductions in the deeper areas of the mine Today Hudbay has expanded the fleet of battery electric vehicles at Lalor to 10 with two more being added in 2026 Continuing to expand the electric equipment fleet and other operational efficiency initiatives will progress the Snow Lake operations towards its 2030 target of a 25 reduction in Scope 1 GHG emissions intensity tonnes of Scope 1 emissions per kilometre compared to a 2022 baselineBritish Columbia At the Copper Mountain mine efforts to drive operational efficiency continue to be a core focus and will enable the BC operations to progress towards its 2030 target of 5 reduction in Scope 1 GHG emissions intensity tonnes of Scope 1 emissions per kilometre compared to a 2024 baseline Hudbay utilizes several pieces of electric equipment at Copper Mountain including three electric shovels and three electric rotary blasthole drills which reduces carbon intensity by displacing existing diesel equipment Additionally the Company took steps to implement renewable diesel also known as hydrotreated vegetable oil HVO fuel to power more than 50 of the haul truck fleet in 2025Corporate Hudbay integrated Scope 1 and Scope 2 GHG emissions into its longrange financial plans to support GHG reduction decision making and alignment with the Companys 2030 goals The Company also implemented sustainability reporting software to standardize the sustainability data collection process In January 2025 the Company established an ESG Steering Committee consisting of the COO CFO and three SVPs to provide enhanced oversight of the Companys sustainability initiatives procedures and disclosures Hudbay plans to advance its Scope 3 data collection process in 2026 through supplier and customer engagement to drive transparency and influence positive GHG behaviours throughout the value chain 2026 Guidance Reflects Stable Copper and Gold Production Industryleading Margins and Investments in Highreturn Growth Opportunities Hudbays key objectives for 2026 are focused on continued operational excellence advancement of organic growth opportunities and prudent capital allocation to deliver attractive highreturn growth Demonstrate continued operational excellence to generate substantial free cash flow through consistent copper and gold production industryleading cost performance and highreturn brownfield reinvestment opportunities Increase mill throughput at Constancia to approximately 90000 tonnes per day in the second half of 2026 through the installation of two pebble crushersContinue mill throughput improvements at New Britannia and recovery enhancements at the Stall millAdvance the 1901 deposit towards full production by the end of 2027Ramp up mill throughput at Copper Mountain to its permitted capacity of 50000 tonnes per day in the second half of 2026 Advance attractive organic growth opportunities to deliver significant increase in longterm production Complete the DFS at Copper World in mid2026 with final sanctioning decision expected in 2026Progress New Ingerbelle permitting and development activities to add production and mine life extension at Copper MountainAdvance economic evaluations of regional satellite properties in Snow Lake including the Talbot coppergoldzinc deposit and the New Britanna gold deposit to further optimize the mine plan and extend mine lifeExecute extensive Snow Lake exploration program to look for new anchor deposits to meaningfully extend mine lifeInitiate prefeasibility study activities at Mason to derisk project developmentAdvance Flin Flon tailings reprocessing opportunities through prefeasibility analysisPrepare for exploration activities at Maria Reyna and Caballito to identify highgrade satellite deposits within trucking distance of Constancias milling infrastructure and provide significant longterm upside potential in Peru Implement the Capital Allocation Framework to maintain strong financial discipline and maximize returns Continue to reduce total debt outstanding and maintain significant financial flexibility throughout Copper World project buildSource the most efficient project level financing for Copper World as part of the Companys prudent financial plan for developing the projectEvaluate all types of capital redeployment opportunities including reinvestments and shareholder returns to generate the highest riskadjusted returns Hudbays annual production and operating cost guidance along with its annual capital and exploration expenditure forecasts are discussed in detail below Production Guidance Contained Metal in Concentrate and Dor12026 GuidanceYear EndedDec 31 20252025 GuidancePeruCoppertonnes75000 900008515580000 97000Goldounces15000 200007448049000 60000Silverounces1900000 240000024151342475000 3025000Molybdenumtonnes900 110012821300 1500ManitobaGold2ounces180000 220000173453180000 220000Zinctonnes16000 210001764621000 27000Coppertonnes10000 1300092499000 11000Silver2ounces800000 1000000800198800000 1000000British ColumbiaCoppertonnes25000 350002378428000 41000Goldounces22000 320002000118500 28000Silverounces200000 290000252811245000 365000TotalCoppertonnes110000 138000118188117000 149000Goldounces217000 272000267934247500 308000Zinctonnes16000 210001764621000 27000Silverounces2900000 369000034681433520000 4390000Molybdenumtonnes900 110012821300 1500 1Metal reported in concentrate and dor is prior to refining losses or deductions associated with smelter terms and includes other secondary products2Gold and silver production guidance includes gold and silver contained in concentrate produced and gold and silver in dor respectively and includes other secondary products On a consolidated basis Hudbay successfully achieved 2025 production guidance for its primary metals 2025 represents the 11th consecutive year in which Hudbay achieved its annual consolidated copper production guidance since Constancia declared commercial production and the 5th consecutive year achieving its annual consolidated gold production guidance since establishing standalone gold production guidancev Peru achieved the guidance range for copper and exceeded the top end of the gold production guidance range despite the impact from the temporary operational interruption due to social unrest Peru production of silver and molybdenum fell slightly below the low end of guidance Manitoba was previously tracking within the 2025 guidance ranges despite the wildfire impacts but as a result of the weatherrelated power outage in October and the subsequent rampup period required to restore full operational cadence gold and zinc production fell below the low end of their respective ranges However Manitoba achieved guidance for copper and silver production despite these interruptions British Columbia copper production fell below the low end of the guidance range as a result of the unplanned maintenance at the primary SAG mill in the fourth quarter and a higher than anticipated proportion of lower grade stockpile ore processed through the year However gold and silver production in British Columbia achieved guidance ranges despite the lower mill availability in the fourth quarter In 2026 consolidated copper production is expected to increase by 5 to 124000 tonnesvi This is driven by higher expected production in British Columbia as a result of mill throughput rampingup to the targeted 50000 tonnes per day in the second half of 2026 partially offset by the depletion of the highgrade Pampacancha satellite deposit in December 2025 Consolidated gold production in 2026 is expected to decrease by 9 to 244500 ouncesvi as a result of the depletion of Pampacancha but unstreamed gold production is expected to increase in 2026 with higher gold production in Manitoba as operations normalize following unprecedented wildfires in 2025 and continue to achieve strong performance from the New Britannia mill In Peru 2026 copper production is expected to be 82500 tonnesvi a slight decrease of 3 from 2025 due to the depletion of Pampacancha which has been largely offset by higher mill throughput and operating efficiencies Peru expects to install two pebble crushers to increase mill throughput in the second half of 2026 in addition to implementing other mill optimization initiatives Gold production is expected to decline to 17500 ouncesvi lower than 2025 levels as Hudbay optimized the mine plan in 2025 during a period of social unrest by prioritizing Pampacancha mining activities and supplementing mill ore feed from lowgrade stockpiles These shortterm mine plan changes resulted in reduced stripping activities in 2025 which is expected to result in some grade resequencing in 2026 and higher production in 2027 and 2028 Perus 2026 production guidance reflects regularly scheduled semiannual mill maintenance shutdowns at Constancia during the second and fourth quarters of 2026 In Manitoba 2026 gold production is expected to be 200000 ouncesvi an increase of 15 from 2025 reflecting normalized operations after unprecedented wildfires in 2025 continued strong mill throughput at New Britannia and strong gold grades at Lalor New Britannia mill throughput is expected to continue to exceed expectations and operate above 2200 tonnes per day in 2026 far exceeding its original design capacity of 1500 tonnes per day The production guidance anticipates Lalor operating at approximately 4500 tonnes per day supplemented by 35000 tonnes of ore feed from the 1901 deposit in 2026 Zinc production for 2026 is expected to be 18500 tonnesvi representing a 5 increase from 2025 driven by higher production from the 1901 deposit In British Columbia 2026 copper production is expected to be 30000 tonnesvi representing a 26 increase from 2025 driven by the completion of the third ball mill to second SAG mill conversion in late 2025 As previously disclosed Hudbay now expects mill throughput to achieve the targeted 50000 tonnes per day in the second half of 2026 as opposed to early 2026 due to the impacts of reduced throughput at the primary SAG mill Installation of the replacement feed end head at the primary SAG mill is scheduled for early in the third quarter of 2026 Hudbay expects to release an updated threeyear production outlook together with its annual mineral reserve and resource update in March 2026 Cash Cost Guidance Cash cost12026 GuidanceYear Ended Dec 31 20252025GuidancePeru cash cost per pound of copper2lb170 210108135 165Manitoba cash cost per ounce of gold3oz500 800549650 850British Columbia cash cost per pound of copper4lb150 250306245 345Consolidated cash cost per pound of copperlb030 010022015 035original 080 1006Consolidated sustaining cash cost per pound of copper5lb170 210130185 225original 225 2656 1 Cash cost and sustaining cash cost per pound of copper produced net of byproduct credits and cash cost per ounce of gold produced net of byproduct credits are nonGAAP financial performance measures with no standardized definition under IFRS For further information please see the NonGAAP Financial Performance Measures section of this news release 2 Peru cash cost net of byproduct credits per pound of produced assumes byproduct credits are calculated using the gold and silver deferred revenue drawdown rates for the streamed ounces in Peru in effect on December 31 2025 and the following commodity prices for unstreamed production in 2026 3850 per ounce gold and 2000 per pound molybdenum 3 Manitoba cash cost net of byproduct credits per ounce of gold assumes byproduct credits are calculated using the following commodity prices for 2026 475 per pound copper 4200 per ounce silver 130 per pound zinc and an exchange rate of 137 CUS 4 British Columbia cash cost net of byproduct credits per pound of copper assumes byproduct credits are calculated using the following commodity price assumptions for 2026 3850 per ounce gold 4200 per ounce silver and an exchange rate of 137 CUS 5 Includes cash sustaining capital expenditures including payments on capitalized leases and equipment financing payments on certain longterm community agreements royalties as well as accretion and amortization for expected decommissioning activities for producing assets 6 Improved full year 2025 consolidated copper cash cost guidance range to 015 to 035 per pound from prior guidance of 065 to 085 per pound and the original guidance range of 080 to 100 per pound Improved full year 2025 consolidated sustaining copper cash cost guidance range to 185 to 225 per pound from the original guidance range of 225 to 265 per pound Consolidated cash costi in 2026 is expected to remain at historical lows and be within 030 to 010 per pound of copper net of byproduct credits benefiting from higher gold production and the Companys continued focus on maintaining strong cost control across the business driving industryleading margins Sustaining cash costi in 2026 is expected to be within 170 to 210 per pound of copper net of byproduct credits benefitting from higher copper production and higher byproduct credits offset by higher sustaining capital expenditures including substantial capital deferrals from 2025 Copper cash cost in Peru is expected to be between 170 to 210 per pound in 2026 reflecting steady unit operating cost performance offset by lower copper production and byproduct credits compared to 2025 from the depletion of Pampacancha 2026 cash costs are positively affected by lower treatment and refining charges and a new power contract lowering electricity rates Gold cash cost in Manitoba is expected to be between 500 and 800 per ounce an increase compared to 2025 but remaining at industrylow levels driving strong margins compared to current gold prices Copper cash cost in British Columbia is expected to be between 150 and 250 per pound in 2026 a decrease compared to 2025 due to higher copper production higher byproduct credits from higher gold production and higher capitalized stripping related to continued accelerated stripping activities as part of the threeyear stabilization and optimization plan at Copper Mountain Capital Expenditure Guidance Capital Expenditures12in millions2026 GuidanceYear EndedDec 31 20252025 GuidanceSustaining capital3Peru4140013701700Manitoba1050457600British Columbia sustaining capital600337500British Columbia capitalized stripping1300977850Total sustaining capital435031413650Growth capitalPeru40047250Manitoba15074150British Columbia850642750Total growth capital excl Copper World JV14007631150Capitalized exploration250156100Copper World joint venture513507151100 1 Excludes capitalized costs not considered to be sustaining or growth capital expenditures2 2026 Canadian capital expenditures guidance is converted into US dollars using an exchange rate of 137 CUS 2025 135 CUS3 Sustaining capital guidance excludes rightofuse lease and equipment financing additions community agreements and noncash capitalized stripping4 Includes capitalized stripping and development costs5 Copper World growth capital shown on a 100 basis With the announcement of the JV Transaction in August 2025 Hudbay expects to accelerate detailed engineering long lead items and other derisking activities by advancing 20 million in growth capital expenditures to 2025 from future years updating total 2025 Copper World joint venture growth spending guidance to 110 million compared to the original 2025 guidance of 90 million Approximately 35 million of the 2025 updated growth spending was deferred to 2026 Total sustaining capital in 2025 was approximately 50 million lower than guidance due to approximately 10 million lower capitalized stripping in Peru from the impact of social unrest approximately 10 million lower capitalized development at Lalor due to the impact of wildfires and approximately 38 million in sustaining capital deferrals to 2026 partially offset by 13 million higher capitalized stripping in British Columbia Excluding Copper World project costs growth capital in 2025 was approximately 39 million lower than guidance primarily due to timing of expenditure and a majority is expected to be deferred to 2026 Copper World growth spending in 2025 was approximately 39 million lower than guidance due to timing of expenditure a majority of which will be deferred to 2026 2026 total capital spending includes approximately 96 million of capital deferrals from 2025 higher growth capital spending as Hudbay reinvests in several highreturn growth projects and onetime sustaining capital expenditures at the operations as discussed below Peru 2026 sustaining capital expenditures are expected to be maintained at 140 million which includes 20 million of sustaining capital deferrals to 2026 and 18 million in onetime heavy civil works projects offset by lower spending on tailings dam raises Peru 2026 growth capital expenditures of 40 million relate primarily to the installation of two pebble crushers to increase mill throughput starting in the second half of 2026 and includes 13 million in capital deferrals from 2025 Manitoba 2026 sustaining capital expenditures are expected to temporarily increase to 105 million in 2026 primarily as a result of 20 million in onetime expenditures related to a project at New Britannia to lower nitrogen levels 12 million for an accelerated oneyear construction schedule for a dam raise at the Anderson tailings facility and 5 million in capital deferrals from 2025 Underground capitalized development at Lalor is expected to return to normal levels after reduced levels in 2025 from the wildfires Manitoba growth capital expenditures are expected to be 15 million in 2026 and relate primarily to the development of exploration platforms and haulage drifts at the 1901 deposit Manitoba spending guidance excludes approximately 15 million of annual care and maintenance costs related to the Flin Flon facilities in 2026 which are expected to be recorded as other operating expenses British Columbia 2026 sustaining capital expenditures are expected to increase to 60 million in 2026 primarily as a result of 5 million in onetime expenditures related to the replacement of the feed end head at the primary SAG and 13 million in capital deferrals from 2025 In addition Hudbay expects to incur approximately 130 million of capitalized stripping costs in 2026 related to continued accelerated stripping activities as the final year of the threeyear stabilization and optimization plan at Copper Mountain To ensure positive cash flows in British Columbia as the Company executes the last year of accelerated stripping activities during the first quarter of 2026 the Company entered into copper forward sales contracts at an average price of 602 per pound and a zerocost copper collar program at an average floor price of 575 per pound and cap price of 634 per pound on approximately 20 of 2026 copper production in British Columbia British Columbia growth capital expenditures are expected to increase to 85 million in 2026 and includes 10 million in capital deferrals from 2025 Growth capital spending primarily relates to early works and infrastructure development for the New Ingerbelle expansion project Copper World joint venture 2026 growth capital guidance of 135 million primarily relates to feasibility study costs and continued derisking until a Copper World project sanctioning decision including approximately 60 million for accelerated long lead items and derisking activities and 35 million of capital deferrals from 2025 and excludes postproject sanction construction costs which will be updated at the time of project sanction Exploration Guidance Exploration Expenditures in millions2026 GuidanceYear Ended Dec 31 20252025 GuidancePeru1150159190Manitoba2500330300British Columbia2007710Total exploration expenditures850566500Capitalized spending250156100Total exploration expense600410400 1 Peru exploration expenditures exclude approximately 6 million of noncash amortization of community agreements for exploration properties for 2026 2025 5 million 2 Manitoba exploration partially funded by approximately 20 million in Canadian Exploration Expense flowthrough financing proceeds for 2026 2025 10 million Total 2026 exploration expenses are expected to increase to 60 million from 41 million in 2025 as Hudbay continues to execute a multiyear extensive geophysics and drilling program in Snow Lake to extend mine life and explore for new discoveries and focus on the conversion of high value inferred resources at New Ingerbelle as described below In Manitoba 2026 exploration activities will focus on completing the largest geophysics program in the Companys history including 800 kilometres of ground electromagnetic surveys and an extensive airborne geophysics survey The Company plans to complete underground and surface drilling at Lalor to continue expanding its mineral resource and reserve estimates and underground drilling at 1901 from the new exploration drift In addition Hudbay plans to continue drilling activities at several regional targets in 2026 including the Talbot deposit and at other regional prospective areas following up on encouraging results in 2025 A portion of the 2026 Manitoba exploration program will be funded by approximately 20 million in proceeds from a critical minerals premium flowthrough financing completed in late 2025 In British Columbia 2026 exploration activities will focus on the conversion of high value inferred resources at New Ingerbelle to potentially extend mine life at Copper Mountain In Peru 2026 exploration activities will continue to focus on final permitting and drill preparation for the Maria Reyna and Caballito properties near Constancia Website Links Hudbay wwwhudbaycom Managements Discussion and AnalysishttpswwwhudbaymineralscomMDA226 Financial Statements httpswwwhudbaymineralscomFS226 Conference Call and Webcast DateFriday February 20 2026Time1100 am ETWebcastwwwhudbaycomDial in6478468185 or 18337523516 Qualified Person and NI 43101 The technical and scientific information in this news release related to all of Hudbays material mineral projects other than the Copper Mountain mine has been approved by Olivier Tavchandjian P Geo Senior Vice President Exploration and Technical Services The technical and scientific information in this news release related to the Copper Mountain mine has been approved by MarcAndre Brulotte P Geo Director Global Exploration and Resource Evaluation Messrs Tavchandjian and Brulotte are qualified persons pursuant to NI 43101 For a description of the key assumptions parameters and methods used to estimate mineral reserves and resources at Hudbays material mineral properties as well as data verification procedures and a general discussion of the extent to which the estimates of scientific and technical information may be affected by any known environmental permitting legal title taxation sociopolitical marketing or other relevant factors please see the technical reports for the Companys material properties are available on SEDAR at wwwsedarplusca and EDGAR at wwwsecgov Supplemental Information for Talbot Drill Holes FromToAzimuth at interceptDip at interceptHole IDEastingNorthingElevationEastingNorthingElevationTLS02445851759973971196458512599739912062977643TLS025 top45830159969951097458296599699711102918680TLS025 bottom45829359969981119458291599699911242917679TLS026458322599718490645831859971859132822642TLS027W02458241599700888145823359970128982970602 NonGAAP Financial Performance Measures Adjusted net earnings loss attributable to owners adjusted net earnings loss per share attributable to owners adjusted EBITDA net debt net debt to adjusted EBITDA free cash flow cash cost sustaining and allin sustaining cash cost per pound of copper produced cash cost and sustaining cash cost per ounce of gold produced combined unit cost and ratios based on these measures are nonGAAP performance measures These measures do not have a meaning prescribed by IFRS and are therefore unlikely to be comparable to similar measures presented by other issuers These measures should not be considered in isolation or as a substitute for measures prepared in accordance with IFRS and are not necessarily indicative of operating profit or cash flow from operations as determined under IFRS Other companies may calculate these measures differently Management believes adjusted net earnings loss attributable to owners and adjusted net earnings loss per share attributable to owners provides an alternate measure of the Companys performance for the current period and gives insight into its expected performance in future periods These measures are used internally by the Company to evaluate the performance of its underlying operations and to assist with its planning and forecasting of future operating results As such the Company believes these measures are useful to investors in assessing the Companys underlying performance Hudbay provides adjusted EBITDA to help users analyze the Companys results and to provide additional information about its ongoing cash generating potential in order to assess its capacity to service and repay debt carry out investments and cover working capital needs Net debt is shown because it is a performance measure used by the Company to assess its financial position Net debt to adjusted EBITDA is shown because it is a performance measure used by the Company to assess its financial leverage and debt capacity Free cash flow is shown as it provides investors and management additional information in assessing the Companys ability to generate cash flow from current operations after investing in capital to sustain the operations Cash cost sustaining and allin sustaining cash cost per pound of copper produced are shown because the Company believes they help investors and management assess the performance of its operations including the margin generated by the operations and the Company Cash cost and sustaining cash cost per ounce of gold produced are shown because the Company believes they help investors and management assess the performance of its Manitoba operations Combined unit cost is shown because Hudbay believes it helps investors and management assess the Companys cost structure and margins that are not impacted by variability in byproduct commodity prices The following tables provide detailed reconciliations to the most comparable IFRS measures Adjusted Net Earnings Loss Reconciliation Three Months EndedYear Endedin millionsDec 31 2025Sep 30 2025Dec 31 2024Dec 31 2025Dec 31 2024Net earnings for the period128022241935643678Tax expense1291108184434771838Earnings before tax25713305103791202516Adjusting itemsMarktomarket adjustments1578710362271Foreign exchange loss gain5488174186210Reevaluation adjustment environmental provision0214250235Manitoba cost of sales and other expense from temporary shutdown05242300Peru cost of sales from temporary shutdown21109130Insurance Recovery250250Consideration received from sale of noncore project149149Copper World impairment reversal32233223Variable consideration adjustment stream revenue and accretion10540Inventory adjustments0713134129Restructuring charges0112Reduction of obligation to renounce flowthrough share expenditures net of provisions1608105520Losswritedown reversal of on disposal of PPampE290314135274Changes in other provisions noncapital07Adjusted earnings before income taxes2254449129757303297Tax expense1291108184434771838Tax impact on adjusting items103733234371308Adjusted net earnings86010168726241767Adjusted net earnings attributable to noncontrolling interestNet loss earnings for the period194289Adjusting items including tax impact031142Adjusted net earnings attributable to owners86010170326561814Adjusted net earnings share attributable to owners022003018067048Basic weighted average number of common shares outstanding millions39633957394039553768 1 Includes changes in fair value of the gold prepayment liability Canadian junior mining investments other financial assets and liabilities at fair value through profit or loss and sharebased compensation expenses recoveries Also includes gains and losses on disposition of investments Adjusted EBITDA Reconciliation Three Months EndedYear Endedin millionsDec 31 2025Sep 30 2025Dec 31 2024Dec 31 2025Dec 31 2024Net earnings for the period128022241935643678Add backTax expense1291108184434771838Net finance expense1461963441941487Other expense1369122178574Depreciation and amortization1525827122243974266Amortization of deferred revenue and variable consideration adjustment24063262750705Adjusting items pretaxImpairment reversal32233223Consideration received from sale of Eva Copper Project149149Reevaluation adjustment environmental provision0214250235Inventory adjustments0713134129Overhead costs incurred during Manitoba temporary suspension cash160192Overhead costs incurred during Peru temporary suspension cash137386Option agreement proceeds Marubeni09114504Realized loss on nonQP hedges422389Sharebased compensation expenses125819715599186Adjusted EBITDA385914262573106098225 1 Sharebased compensation expenses reflected in cost of sales and selling and administrative expenses Net Debt Reconciliation in millionsDec 31 2025Sep 30 2025Dec 31 2024Total debt100861047011075Less Cash and cash equivalents568961115418Less Shortterm investments400Net debt439743595257in millions except net debt to adjusted EBITDA ratioNet debt439743595257Adjusted EBITDA 12month period1060993238225Net debt to adjusted EBITDA040506 Trailing Adjusted EBITDAThree Months Endedin millionsDec 31 2025Sep 30 2025Jun 30 2025Mar 31 2025Dec 31 2024Earnings loss for the period128022241147992193Add backTax expense12911081384721844Net finance expense146196144344Other expenses136917152221Depreciation and amortization152582796410811222Amortization of deferred revenue and variable consideration adjustment24063154293262Adjusting items pretaxImpairment reversal3223Consideration received from Eva Copper Project149Reevaluation adjustment environmental provision021413812825Inventory adjustments0713351213Overhead costs incurred during Manitoba temporary suspension cash16032Overhead costs incurred during Peru temporary suspension cash1373Realized loss on nonQP hedges041942Option agreement proceeds Marubeni11111015Sharebased compensation expenses12581971053915Adjusted EBITDA38591426245228722573LTM210609932399578957 1 Sharebased compensation expense reflected in cost of sales and administrative expenses 2 LTM last twelve months as of December 31 2025 Annual consolidated results may not be calculated based on the amounts presented in this table due to rounding Free Cash Flow Reconciliation in millionsThree Months EndedYear EndedDec 31 2025Sep 30 2025Dec 31 2024Dec 31 2025Dec 31 2024Cash generated from operations20941135238170736662Adjusting itemsChange in noncash working capital127543266570249Cash sustaining capital expenditures1108785582637643340Free cash flow2282152148938793571Cash sustaining capital expenditures1Total sustaining capital costs91871271631412931Capitalized lease and equipment financing cash payments operating sites125143103530384Community agreement cash payments44079325Cash sustaining capital expenditures1108785582637643340 Three Months Endedin millionsDec 31 2025Sep 30 2025Jun 30 2025Mar 31 2025LTM2Cash generated from operations20941135259612487073Adjusting itemsChange in noncash working capital1275432660387570Cash sustaining capital expenditures1108785510617613764Free cash flow22821528758743879Cash sustaining capital expenditures1Total sustaining capital costs9187128866253141Capitalized lease and equipment financing cash payments operating sites125143134128530Community agreement cash payments44410893Cash sustaining capital expenditures1108785510617613764 1 Excludes amortization of decommissioning and restoration PPampE assets and accretion of decommissioning and restoration liabilities related to producing sites 2 LTM last twelve months as at December 31 2025 Copper Cash Cost Reconciliation ConsolidatedThree Months EndedYear EndedNet pounds of copper produced1in thousandsDec 31 2025Sep 30 2025Dec 31 2024Dec 31 2025Dec 31 2024Peru551993993474931187734218260Manitoba7333185673792039127637British Columbia21037311572130675243558215Net pounds of copper produced729055336295377260560304112 1 Contained copper in concentrate ConsolidatedThree Months EndedDec 31 2025Sep 30 2025Dec 31 2024Cash cost per pound of copper produced millionslb millionslb millionslbMining10321427021321081113Milling965132758142954100GampA734101318059506053Onsite costs273137517783332541266Treatment amp refining5800853010259027Freight amp other251034149028286030Cash cost before byproduct credits304041719803713086323Byproduct credits350048017583292655278Cash cost net of byproduct credits460063222042431045 Year EndedDec 31 2025Dec 31 2024Cash cost per pound of copper produced millionslb millionslbMining35041343940130Milling34551333521116GampA19190741628054Onsite costs88783419089300Treatment amp refining284011973031Freight amp other8510331011033Cash cost before byproduct credits1001338411073364Byproduct credits105784069674318Cash cost net of byproduct credits5650221399046 ConsolidatedThree Months EndedDec 31 2025Sep 30 2025Dec 31 2024Supplementary cash cost information millionslb1 millionslb1 millionslb1Byproduct credits2Zinc12201799018161017Gold3302241513482532129223Silver3273037139026266028Molybdenum amp other8301117203299010Total byproduct credits350048017583292655278Reconciliation to IFRSCash cost net of byproduct credits460222431Byproduct credits350017582655Treatment and refining charges5853259Sharebased compensation expense261707Inventory adjustments071313Past service costs15Change in product inventory43196100Royalties322021Overhead costs incurred during Manitoba temporary suspension cash160Overhead costs incurred during Peru temporary suspension cash1373Depreciation and amortization415258271222Cost of sales5462828154005 Year EndedDec 31 2025Dec 31 2024Supplementary cash cost information millionslb1 millionslb1Byproduct credits2Zinc432017699023Gold385823297478246Silver3907035860028Molybdenum amp other657025637021Total byproduct credits105784069674318Reconciliation to IFRSCash cost net of byproduct credits5651399Byproduct credits105789674Treatment and refining charges284973Sharebased compensation expense5919Inventory adjustments4129Past service costs43Change in product inventory81114Royalties93103Overhead costs incurred during Manitoba temporary suspension cash192Overhead costs incurred during Peru temporary suspension cash86Depreciation and amortization443974266Cost of sales51467814674 1Per pound of copper produced 2 Byproduct credits are computed as revenue per consolidated financial statements including amortization of deferred revenue and pricing and volume adjustments 3 Gold and silver byproduct credits do not include variable consideration adjustments with respect to stream arrangements Variable consideration adjustments are cumulative adjustments to gold and silver stream deferred revenue primarily associated with the net change in mineral reserves and resources or amendments to the mine plan that would change the total expected deliverable ounces under the precious metal streaming arrangement For the three months ended December 31 2025 the variable consideration adjustments amounted to nil three months ended December 31 2024 nil and September 30 2025 nil For the year ended December 31 2025 the variable consideration adjustments amounted to a gain of 99 million year ended December 31 2024 loss of 38 million 4 Depreciation is based on concentrate sold 5 As per consolidated financial statements PeruThree Months EndedYear Endedin thousandsDec 31 2025Sep 30 2025Dec 31 2024Dec 31 2025Dec 31 2024Net pounds of copper produced1551993993474931187734218260 1 Contained copper in concentrate PeruThree Months EndedDec 31 2025Sep 30 2025Dec 31 2024Cash cost per pound of copper produced millionslb millionslb millionslbMining376068348087473063Milling520094408102536072GampA478087193048332044Onsite costs13742499492371341179Treatment amp refining2500534008160021Freight amp other17303194024192025Cash cost before byproduct credits157228510772691693225Byproduct credits1260228555139940125Cash cost net of byproduct credits312057522130753100 Year EndedDec 31 2025Dec 31 2024Cash cost per pound of copper produced millionslb millionslbMining13150701455067Milling19501041971090GampA1128060955044Onsite costs43932344381201Treatment amp refining125007534024Freight amp other543029625029Cash cost before byproduct credits50612705540254Byproduct credits30351622958136Cash cost net of byproduct credits20261082582118 PeruThree Months EndedDec 31 2025Sep 30 2025Dec 31 2024Supplementary cash cost information millionslb1 millionslb1 millionslb1Byproduct credits2Gold31047190313078685091Silver313202470018168022Molybdenum8101417204387012Total byproduct credits1260228555139940125Reconciliation to IFRSCash cost net of byproduct credits312522753Byproduct credits1260555940Treatment and refining charges2534160Inventory adjustments021302Sharebased compensation expenses050201Change in product inventory15626967Royalties291515Overhead costs incurred during Peru temporary suspension cash1373Depreciation and amortization41158500832Cost of sales5290613512312 Year EndedDec 31 2025Dec 31 2024Supplementary cash cost information millionslb1 millionslb1Byproduct credits2Gold318831001825084Silver3495026513024Molybdenum657036620028Total byproduct credits30351622958136Reconciliation to IFRSCash cost net of byproduct credits20262582Byproduct credits30352958Treatment and refining charges125534Inventory adjustmentsSharebased compensation expenses1005Change in product inventory6596Royalties6567Overhead costs incurred during Peru temporary suspension cash86Depreciation and amortization429002703Cost of sales580627877 1Per pound of copper produced 2 Byproduct credits are computed as revenue per consolidated financial statements including amortization of deferred revenue and pricing and volume adjustments 3 Gold and silver byproduct credits do not include variable consideration adjustments with respect to stream arrangements 4 Depreciation is based on concentrate sold 5 As per the consolidated financial statements British ColumbiaThree Months Ended Year Endedin thousandsDec 31 2025Sep 30 2025Dec 31 2024Dec 31 2025Dec 31 2024Net pounds of copper produced1 1037311572130675243558215 1 Contained copper in concentrate British ColumbiaThree Months EndedDec 31 2025Sep 30 2025Dec 31 2024Cash cost per pound of copper produced millionslb millionslb millionslbMining263254196169182139Milling283273291252252193GampA950917106146035Onsite costs641618558482480367Treatment amp refining130121000934026Freight amp other270263002624019Cash cost before byproduct credits681656598517538412Byproduct credits181174227196146112Cash cost net of byproduct credits500482371321392300Year EndedDec 31 2025Dec 31 2024Cash cost per pound of copper produced millionslb millionslbMining920176791136Milling1006192898154GampA290055196034Onsite costs22164231885324Treatment amp refining80015144025Freight amp other124023132022Cash cost before byproduct credits24204612161371Byproduct credits813155565097Cash cost net of byproduct credits16073061596274 British ColumbiaThree Months EndedYear EndedDec 31 2025Sep 30 2025Dec 31 2024Dec 31 2025Dec 31 2024Supplementary cash cost informationmillionslb1millionslb1millionslb1millionslb1millionslb1Byproduct credits2Gold149143204176133102712136493085Silver32031230201301010101972012Total byproduct credits181174227196146112813155565097Reconciliation to IFRSCash cost net of byproduct credits50037139216071596Byproduct credits181227146813565Treatment and refining charges13103480144Share based payment0705041704Change in product inventory9142302138Inventory adjustments01122312Royalties0305062836Depreciation and amortization3141164118633501Cost of sales472980461430202608 1 Per pound of copper produced 2 Byproduct credits are computed as revenue per consolidated financial statements including amortization of deferred revenue and pricing and volume adjustments 3 Depreciation is based on concentrate sold 4 As per consolidated financial statements Sustaining and Allin Sustaining Cash Cost Reconciliation ConsolidatedThree Months EndedDec 31 2025Sep 30 2025Dec 31 2024Allin sustaining cash cost per pound of copper producedmillionslbmillionslbmillionslbCash cost net of byproduct credits460063222042431045Cash sustaining capital expenditures1112153875164853089Royalties320042000321003Sustaining cash cost net of byproduct credits68409411172091305137Corporate selling and administrative expenses amp regional costs320044330062116012Accretion and amortization of decommissioning and community agreements1400053900737004Allin sustaining cash cost net of byproduct credits104414314862781458153Reconciliation to property plant and equipment additionsProperty plant and equipment additions14099761276Capitalized stripping net additions439432358Total accrued capital additions184814081634Less other nonsustaining capital costs2930696918Total sustaining capital costs918712716Capitalized lease amp equipment financing cash payments operating sites125143103Community agreement cash payments34407Accretion and amortization of decommissioning and restoration obligations4252027Cash sustaining capital expenditures1112875853 1 Includes accretion of decommissioning relating to nonproductive sites and accretion and amortization of current community agreements 2 Other nonsustaining capital costs include Copper World capitalized costs capitalized interest capitalized exploration rightofuse lease asset additions equipment financing asset additions growth capital expenditures and reclassification related to capital spares 3 Amortization for community agreements relating to current operations 4 Includes amortization of decommissioning and restoration PPampE assets and accretion of decommissioning and restoration liabilities related to producing sites ConsolidatedYear EndedDec 31 2025Dec 31 2024Allin sustaining cash cost per pound of copper producedmillionslbmillionslbCash cost net of byproduct credits5650221399046Cash sustaining capital expenditures38521483422113Royalties93002103003Sustaining cash cost net of byproduct credits33801304924162Corporate selling and administrative expenses amp regional costs1024039624020Accretion and amortization of decommissioning and community agreements1131005173006Allin sustaining cash cost net of byproduct credits45351745721188Reconciliation to property plant and equipment additionsProperty plant and equipment additions40033257Capitalized stripping net additions18221605Total accrued capital additions58254862Less other nonsustaining capital costs226841931Total sustaining capital costs31412931Capitalized lease amp equipment financing cash payments operating sites530384Community agreement cash payments39325Accretion and amortization of decommissioning and restoration obligations48882Cash sustaining capital expenditures38523422 1 Includes accretion of decommissioning relating to nonproductive sites and accretion and amortization of community agreements capitalized to Other assets 2 Other nonsustaining capital costs include Copper World capitalized costs capitalized interest capitalized exploration rightofuse lease asset additions equipment financing asset additions growth capital expenditures and reclassification related to capital spares 3 Amortization for community agreements relating to current operations 4 Includes amortization of decommissioning and restoration PPampE assets and accretion of decommissioning and restoration liabilities related to producing sites PeruThree Months EndedYear EndedDec 31 2025Sep 30 2025Dec 31 2024Dec 31 2025Dec 31 2024Sustaining cash cost per pound of copper producedmillionslbmillionslbmillionslbmillionslbmillionslbCash cost net of byproduct credits31205752213075310020261082582118Cash sustaining capital expenditures50309130507734304617120911416065Royalties2900515004150026500367003Sustaining cash cost per pound of copper produced844153842211111114838032024065186 British ColumbiaThree Months EndedYear EndedDec 31 2025Sep 30 2025Dec 31 2024Dec 31 2025Dec 31 2024Sustaining cash cost per pound of copper producedmillionslbmillionslbmillionslbmillionslbmillionslbCash cost net of byproduct credits50048237132139230016073001596274Cash sustaining capital expenditures41740248441835427115753001445248Royalties0300305004060052800636007Sustaining cash cost per pound of copper produced92088786074375257632106123077529 Gold Cash Cost and Sustaining Cash Cost Reconciliation ManitobaThree Months EndedYear Endedin thousandsDec 31 2025Sep 30 2025Dec 31 2024Dec 31 2025Dec 31 2024Net ounces of gold produced1474232244151438173453214225 1 Contained gold in concentrate and dor ManitobaThree Months EndedDec 31 2025Sep 30 2025Dec 31 2024Cash cost per ounce of gold producedmillionsozmillionsozmillionsozMining393829158704426828Milling16234259263166323GampA16133954241128249Onsite costs716151027112087201400Treatment amp refining2042094065126Freight amp other511082511170136Cash cost before byproduct credits787166030513598551662Byproduct credits4539552209805431055Gold cash cost net of byproduct credits33470585379312607 Year EndedDec 31 2025Dec 31 2024Cash cost per ounce of gold producedmillionsozmillionsozMining12697311694791Milling499288652304GampA501289477223Onsite costs2269130828231318Treatment amp refining7945295137Freight amp other184106254119Cash cost before byproduct credits2532145933721574Byproduct credits15799102073968Gold cash cost net of byproduct credits9535491299606 ManitobaThree Months EndedDec 31 2025Sep 30 2025Dec 31 2024Supplementary cash cost informationmillionsoz1millionsoz1millionsoz1Byproduct credits2Copper22146674330285554Zinc12225799441161313Silver1082284720985165Other0241223Total byproduct credits4539552209805431055Reconciliation to IFRSCash cost net of byproduct credits33485312Byproduct credits453220543Treatment and refining charges200965Inventory adjustments0803Past service cost15Sharebased compensation expenses141002Change in product inventory223103Overhead costs incurred during temporary suspension160Depreciation and amortization3226163272Cost of sales49936601079 Year EndedDec 31 2025Dec 31 2024Supplementary cash cost informationmillionsoz1millionsoz1Byproduct credits2Copper8364821082505Zinc432249699326Silver311179275128Other179Total byproduct credits15799102073805Reconciliation to IFRSCash cost net of byproduct credits9531299Byproduct credits15792073Treatment and refining charges79295Inventory adjustments1817Past service cost43Sharebased compensation expenses3210Change in product inventory3720Overhead costs incurred during Manitoba temporary suspension cash192Depreciation and amortization38641062Cost of sales435964189 1 Per ounce of gold produced 2 Byproduct credits are computed as revenue per consolidated financial statements amortization of deferred revenue pricing and volume adjustments 3 Depreciation is based on concentrate sold 4 As per consolidated financial statements ManitobaThree Months EndedYear EndedDec 31 2025Sep 30 2025Dec 31 2024Dec 31 2025Dec 31 2024Sustaining cash cost per ounce of gold producedmillionsozmillionsozmillionsozmillionsozmillionsozGold cash cost net of byproduct credits334705853793126079535491299606Cash sustaining capital expenditures19240586383155301565326561262Sustaining cash cost per ounce of gold produced526111017176246790815188751860868 Combined Unit Cost Reconciliation PeruThree Months EndedYear Endedin millions except ore tonnes milled and unit cost per tonneCombined unit cost per tonne processedDec 31 2025Sep 30 2025Dec 31 2024Dec 31 2025Dec 31 2024Mining37634847313151455Milling52040853619501971GampA14781933321128955Other GampA226738121449259Unit cost1107911122039444122Tonnes ore milled7628699279993029331934Combined unit cost per tonne14511303152513021291Reconciliation to IFRSUnit cost1107911122039444122Freight amp other17394192543625Inventory adjustments021302Other GampA26738121449259Sharebased compensation expenses0502011005Change in product inventory156269676596Royalties2915156567Overhead costs incurred during Peru temporary suspension cash137386Depreciation and amortization115850083229002703Cost of sales329061351231280627877 1 GampA as per cash cost reconciliation above 2 Other GampA primarily includes profit sharing costs 3 As per consolidated financial statements British ColumbiaThree Months EndedYear Endedin millions except tonnes ore milled and unit cost per tonneCombined unit cost per tonne processedDec 31 2025Sep 30 2025Dec 31 2024Dec 31 2025Dec 31 2024Mining263196182920791Milling2832912521006898GampA1957146290196Unit cost64155848022161885USDCAD implicit exchange rate141138138140137Unit cost C90377366930972581Tonnes ore milled2268308728811101712657Combined unit cost per tonne C39802502232228122039Reconciliation to IFRSUnit cost64155848022161885Freight amp other273024124132Sharebased compensation expenses0705041704Change in product inventory9142302138Inventory adjustments01122312Royalties0305062836Depreciation and amortization141164118633501Cost of sales272980461430202608 1 GampA as per cash cost reconciliation above2 As per consolidated financial statements ManitobaThree Months EndedYear Endedin millions except tonnes ore milled and unit cost per tonneCombined unit cost per tonne processedDec 312025Sep 30 2025Dec 31 2024Dec 31 2025Dec 31 2024Mining39315842612691694Milling16259166499652GampA116154128501477Less Other GampA related to profit sharing costs941840256170Unit cost62225368020132653USDCAD implicit exchange rate139139139140137Unit cost C86735395028243635Tonnes ore milled34908213670540759611973351608708Combined unit cost per tonne C248258233236226Reconciliation to IFRSUnit cost62225368020132653Freight amp other512570184254Other GampA related to profit sharing941840256170Sharebased compensation expenses1410023210Inventory adjustments08031817Past service cost1543Change in product inventory2231033720Overhead costs incurred during Manitoba temporary suspension cash160192Depreciation and amortization2261632728641062Cost of sales2993660107935964189 1 GampA as per cash cost reconciliation above 2 As per consolidated financial statements ForwardLooking Information This news release contains forwardlooking information within the meaning of applicable Canadian and United States securities legislation All information contained in this news release other than statements of current and historical fact is forwardlooking information Often but not always forwardlooking information can be identified by the use of words such as plans expects budget guidance scheduled estimates forecasts strategy target intends objective goal understands anticipates and believes and variations of these or similar words and statements that certain actions events or results may could would should might occur or be achieved or will be taken and variations of these or similar expressions All of the forwardlooking information in this news release is qualified by this cautionary note Forwardlooking information includes but is not limited to statements with respect to Hudbays production cost and capital and exploration expenditure guidance Hudbays ability to advance and complete the multiyear optimization of the Copper Mountain mine in British Columbia including with respect to the ongoing second SAG mill conversion and configuration project and with respect to the primary SAG mill repairs and related rampup plans the implementation of stripping strategies and the expected benefits therefrom the expected timing and benefits of British Columbia growth initiatives including with respect to the permitting and development timelines associated with New Ingerbelle the estimated timelines and prerequisites for sanctioning the Copper World project expectations regarding the anticipated benefits of the JV Transaction and the sanctioning of the Copper World project to Hudbay and the United States the consummation and timing of the DFS in respect of the Copper World project expectations regarding the potential impact of recent policy decisions from the United States government the benefits timing and consummation of the definitive agreement with Wheaton Precious Metals Corp Wheaton in respect of the enhanced precious metals stream at Copper World the expected benefits of Manitoba growth initiatives including the use of the exploration drift at the 1901 deposit the ability for Hudbay to complete mill throughput enhancements at its operating business units in Peru British Columbia and Manitoba Hudbays future deleveraging strategies and Hudbays ability to deleverage and repay debt as needed expectations regarding Hudbays cash balance and liquidity and related cash management strategies expectations regarding Hudbays capital planning strategies including but not limited to Hudbays enhanced Capital Allocation Framework expectations regarding tax synergies expectations regarding the ability to conduct exploration work and execute on exploration programs on its properties and to advance related drill plans including the advancement of the exploration program at Maria Reyna and Caballito and the status and anticipated timing of the related drill permit application process expectations regarding the prospective nature of the Maria Reyna and Caballito properties Hudbays evaluation and assessment of opportunities to reprocess tailings using various metallurgical technologies the anticipated impact of brownfield and greenfield growth projects on Hudbays performance anticipated exploration and expansion opportunities and extension of mine life in Snow Lake and Hudbays ability to find a new anchor deposit near Hudbays Snow Lake operations anticipated future drill programs and exploration activities and any results expected therefrom the enhancement of stakeholder engagement and advancement of a prefeasibility study and related test work at the Mason copper project in Nevada anticipated mine plans anticipated metals prices and the anticipated sensitivity of Hudbays financial performance to metals prices events that may affect Hudbays operations and development projects anticipated cash flows from operations and related liquidity requirements the ability to successfully obtain proceeds from insurance claims the ability to achieve Hudbays climate change goals and initiatives the anticipated effect of external factors on revenue such as commodity prices estimation of mineral reserves and resources mine life projections reclamation costs economic outlook government regulation of mining operations and business and acquisition strategies Forwardlooking information is not and cannot be a guarantee of future results or events Forwardlooking information is based on among other things opinions assumptions estimates and analyses that while considered reasonable by Hudbay at the date the forwardlooking information is provided inherently are subject to significant risks uncertainties contingencies and other factors that may cause actual results and events to be materially different from those expressed or implied by the forwardlooking information The material factors or assumptions that Hudbay has identified and were applied in drawing conclusions or making forecasts or projections set out in the forwardlooking information include but are not limited to the ability to achieve production cost and capital and exploration expenditure guidanceno significant interruptions to Hudbays operations due to social or political unrest in the regions Hudbay operates including the navigation of the complex political and social environment in Peru and the resolution of grievances raised by local communities and their residentsthe ability to consummate the definitive agreement with Wheaton in respect of the enhanced precious metals stream at Copper Worldno interruptions to Hudbays plans for advancing the Copper World project including with respect to any successful challenges to the Copper World permitsHudbays ability to successfully advance and complete the optimization of the Copper Mountain operations obtain required permits and develop and maintain good relations with key stakeholdersthe ability to execute on its exploration plans and to advance related drill plansthe ability to advance the exploration program at the Maria Reyna and Caballito propertiesthe success of mining processing exploration and development activitiesthe scheduled maintenance and availability of Hudbays processing facilitiesthe accuracy of geological mining and metallurgical estimatesanticipated metals prices and the costs of productionthe supply and demand for metals Hudbay producesthe supply and availability of all forms of energy and fuels at reasonable pricesno significant unanticipated operational or technical difficultiesno significant interruptions to operations due to adverse effects from extreme weather events including forest fires that have affected and may continue to affect the regions in which Hudbay operatesthe execution of Hudbays business and growth strategies including the success of its strategic investments and initiativesthe availability of additional financing if neededthe ability to deleverage and repay debt as neededthe ability to complete project targets on time and on budget and other events that may affect Hudbays ability to develop Hudbays projectsthe timing and receipt of various regulatory and governmental approvalsthe availability of personnel for Hudbays exploration development and operational projects and ongoing employee relationsmaintaining good relations with the employees at Hudbays operationsmaintaining good relations with the labour unions that represent certain of Hudbay employees in Manitoba and Perumaintaining good relations with the communities in which Hudbay operates including the neighbouring Indigenous communities and local governmentsno significant unanticipated challenges with stakeholders at Hudbays various projectsno significant unanticipated events or changes relating to regulatory environmental health and safety mattersno contests over title to Hudbays properties including as a result of rights or claimed rights of Indigenous peoples or challenges to the validity of Hudbays unpatented mining claimsthe timing and possible outcome of pending litigation and no significant unanticipated litigationcertain tax matters including but not limited to current tax laws and regulations changes in taxation policies and the refund of certain value added taxes from the Canadian and Peruvian governments andno significant and continuing adverse changes in general economic conditions or conditions in the financial markets including commodity prices and foreign exchange rates The risks uncertainties contingencies and other factors that may cause actual results to differ materially from those expressed or implied by the forwardlooking information may include but are not limited to risks associated with reaching a definitive agreement with Wheaton in respect of the enhanced precious metals stream risks related to the failure to effectively advance and complete the optimization of the Copper Mountain mine operations including with respect to the ongoing second SAG mill conversion and configuration project and with respect to the primary SAG mill repairs and related rampup plans political and social risks in the regions Hudbay operates including the complex political and social environment in Peru and potential disruptions to operations arising from community protests and grievances risks generally associated with the mining industry and the current geopolitical environment including future commodity prices the potential implementation or expansion of tariffs currency and interest rate fluctuations energy and consumable prices supply chain constraints and general cost escalation in the current inflationary environment uncertainties related to the development and operation of Hudbays projects the risk of an indicator of impairment or impairment reversal relating to a material mineral property risks related to the Copper World project including in relation to project delivery and financing risks risks related to the Lalor mine plan including the ability to convert inferred mineral resource estimates to higher confidence categories dependence on key personnel and employee and union relations risks related to political or social instability unrest or change risks in respect of Indigenous and community relations rights and title claims operational risks and hazards including the cost of maintaining and upgrading Hudbays tailings management facilities and any unanticipated environmental industrial and geological events and developments and the inability to insure against all risks including any unanticipated significant interruptions to operations due to adverse effects from extreme weather events failure of plant equipment processes transportation and other infrastructure to operate as anticipated compliance with government and environmental regulations including permitting requirements and antibribery legislation depletion of Hudbays reserves volatile financial markets and interest rates that may affect Hudbays ability to obtain additional financing on acceptable terms the failure to obtain required approvals or clearances from government authorities on a timely basis uncertainties related to the geology continuity grade and estimates of mineral reserves and resources and the potential for variations in grade and recovery rates uncertain costs of reclamation activities Hudbays ability to comply with Hudbays pension and other postretirement obligations Hudbays ability to abide by the covenants in Hudbays debt instruments and other material contracts tax refunds hedging transactions as well as the risks discussed under the heading Risk Factors in Hudbays most recent Annual Information Form which is available on the Companys SEDAR profile at wwwsedarplusca and the Companys EDGAR profile at wwwsecgov Should one or more risk uncertainty contingency or other factor materialize or should any factor or assumption prove incorrect actual results could vary materially from those expressed or implied in the forwardlooking information Accordingly you should not place undue reliance on forwardlooking information Hudbay does not assume any obligation to update or revise any forwardlooking information after the date of this news release or to explain any material difference between subsequent actual events and any forwardlooking information except as required by applicable law Note to United States Investors This news release has been prepared in accordance with the requirements of the securities laws in effect in Canada which may differ materially from the requirements of United States securities laws applicable to US issuers About Hudbay Hudbay TSX NYSE HBM is a copperfocused critical minerals mining company with three longlife operations and a worldclass pipeline of copper growth projects in tierone mining jurisdictions of Canada Peru and the United States Hudbays operating portfolio includes the Constancia mine in Cusco Peru the Snow Lake operations in Manitoba Canada and the Copper Mountain mine in British Columbia Canada Copper is the primary metal produced by the Company which is complemented by meaningful gold production and byproduct zinc silver and molybdenum Hudbays growth pipeline includes the Copper World project in Arizona United States the Mason project in Nevada United States the Llaguen project in La Libertad Peru and several expansion and exploration opportunities near its existing operations The value Hudbay creates and the impact it has is embodied in its purpose statement We care about our people our communities and our planet Hudbay provides the metals the world needs We work sustainably transform lives and create better futures for communities Hudbays mission is to create sustainable value and strong returns by leveraging its core strengths in community relations focused exploration mine development and efficient operations For further information please contact Candace Brule Senior Vice President Capital Markets amp Corporate Affairs 416 3628181 investorrelationshudbaycom i Adjusted net earnings loss attributable to owners and adjusted net earnings loss per share attributable to owners adjusted EBITDA cash cost sustaining cash cost allin sustaining cash cost per pound of copper produced net of byproduct credits cash cost sustaining cash cost per ounce of gold produced net of byproduct credits combined unit cost net debt net debt to adjusted EBITDA ratio and free cash flow are nonGAAP financial performance measures with no standardized definition under IFRS For further information and a detailed reconciliation please see the discussion under the NonGAAP Financial Performance Measures section of this news release ii The postclosing adjusted yearend cash and cash equivalents of 992 million includes December 31 2025 cash and cash equivalents balance of 5689 million and approximately 420 million of cash at the Copper World LLC level which is designated for exclusive use by the Copper World joint venture Postclosing adjusted liquidity includes the postclosing cash and cash equivalent plus the undrawn availability of 4248 million under Hudbays revolving credit facilities iii Based on the initial capital investment and the 375 per pound copper price used in the PFS published on September 8 2023 with assumptions of approximately 145 million for presanctioning costs 230 million from the precious metals stream 350 million from projectlevel financing and approximately 700 million from Mitsubishis 420 million initial investment 180 million investment within 18 months and its prorata 30 share of future equity capital contributions iv For further information regarding the terms agreed to with Wheaton Precious Metals Corp to enhance and amend the existing precious metals streaming agreement please see Hudbays August 13 2025 news release v In 2020 Hudbays consolidated copper production guidance range was revised during the year due to the impact of COVID19 at the operations Hudbays 2020 copper production was within the revised guidance ranges Prior to 2021 Hudbay provided guidance on a precious metal equivalent instead of gold as a standalone metal vi Calculated using the midpoint of the guidance range

Eldorado Gold Provides 2026 Guidance; Three-Year Outlook Targets 40% Gold Production Growth; Skouries Construction Update
All dollar figures are in US dollars unless otherwise stated VANCOUVER British Columbia Feb 19 2026 GLOBE NEWSWIRE Eldorado Gold Corporation Eldorado or the Company TSX ELD NYSE EGO today provides 2026 production and cost guidance together with a threeyear production outlook that reflects the Companys nearterm growth profile and stepchange to a higher steadystate production level from 2027 onward Consolidated 2026 cost guidance includes the Companys current operating mines the Lamaque Complex Kisladag Efemcukuru and Olympias Cost guidance for Skouries is presented separately First concentrate production at Skouries has been delayed by approximately one quarter to early Q3 2026 with commercial production expected in Q4 2026 As Skouries advances through rampup and reaches commercial production the Company expects to provide updated consolidated cost guidance 2026 Guidance Highlights Total gold production12 of 490000 to 590000 ounces representing an 11 increase from 2025 gold production assuming the midpoint of the rangeOperations Gold production2 of 430000 to 490000 ouncesTotal cash costs23 of 1220 to 1420 per ounce soldAllin sustaining costs AISC3 of 1670 to 1870 per ounce soldGrowth capital3 at operations of 375 to 405 millionSustaining capital3 of 140 to 165 millionOther growth capital3 of approximately 65 million consisting of 50 million towards GHG mitigation projects and 15 million towards advancement of Perama Hill Skouries Gold production1 of 60000 to 100000 ouncesCopper production1 of 20 to 40 million poundsAISC34 of 100 to 200 per ounce soldConstruction project capital of 175 to 185 million including an additional 50 million related to the delay in first concentrate productionAccelerated operational capital of 80 to 90 millionPostcommercial production growth capital34 of 35 to 45 millionSustaining capital34 of 20 to 35 million Exploration expenditures of 75 to 85 million focused on resource conversion drilling at the Lamaque Complex and Olympias as well as resource growth and discovery programs in Canada Turkiye and Greece 3Year Outlook Highlights The threeyear outlook reflects an exciting inflection to significant cash generation in the second half of 2026 with Skouries transitioning into production This positions the Company to unlock the full growth potential of the operation in 2027 when Eldorado is expected to achieve a new steadystate production profile representing approximately 40 growth in gold production compared to 2025 YearGold Production ozChange vs 2025Copper Production lbs2026490000 5900001211 increase20 40 million12027620000 72000040 increase50 70 million2028640000 74000041 increase50 80 million We are entering 2026 with exceptional momentum said George Burns Chief Executive Officer While we have experienced nearterm adjustments to the Skouries schedule as we work through commissioning and ramp up the fundamentals of the project remain excellent and demonstrate a strong cash flow yielding operation for the next few decades Bringing Skouries online is an important milestone that fundamentally reshapes our cash generation production profile and cost structure In addition across our portfolio we continue to advance key initiatives that support a step change in growth operational performance and longterm value creation At Kisladag installation of a larger secondary crusher later this year is expected to unlock throughput debottlenecking opportunities while completion of the geometallurgical study will help inform future mining phases and evaluate the potential benefits of additional HPGR screening At Olympias the expansion to 650 ktpa remains on track for completion in the second half of the year positioning the operation for higher production volumes and improved unit costs as it enters its next phase At the Lamaque Complex development of Ormaque is accelerating as we transition from bulk sample completion to fullscale mine development supporting sustained production growth across the complex With gold production expected to increase by approximately 40 in 2027 complemented by the addition of meaningful copper production Eldorado will enter a period of substantial free cash flow generation Free cash flow growth is driven by higher production volumes and improved margins with the addition of longlife lowcost production from Skouries and is supported by a stable portfolio of high performing operations Detailed 2026 Production and Cost Guidance 2026 Guidance5Lamaque ComplexKisladagEfemcukuru7Olympias78Skouries Project9Total10ProductionGold 000 oz185 2002105 13070 8070 8060 1001490 59012Copper M lb20 40120 401Silver 000 oz1550 17501550 1750Lead 000 t 15 1815 18Zinc 000 t16 1916 19Tonnes Processed millions095 100125 135053 055051 05420 35Gold Grade gt60 6505 0645 5075 8010 12OperationsTotal Cash Costs3 oz sold 790 9901830 20801680 18801030 12301220 1420Allin Sustaining Costs3 oz sold1160 13602100 23502010 22101370 15701670 1870SkouriesAllin Sustaining Costs3 oz sold100 200100 200Capital Expenditures millionsOperationsSustaining370 8025 3020 2525 30140 165Growth36180 190130 14025 3040 45375 405SkouriesProject Capital175 185175 185Accelerated Operational80 9080 90Growth31135 4535 45Sustaining31120 3520 35 Total gold production in 2026 is expected to be secondhalf weighted with approximately 65 in H2 2026 driven by the rampup of Skouries the rampup at Olympias and the impact of mine waste stripping and grade profile at Kisladag Total cash costs3 in 2026 for the operations are expected to be between 1220 and 1420 per ounce sold and AISC3 for the operations of between 1670 and 1870 per ounce sold The expected increase in 2026 costs is driven by forecasted higher labour costs as a result of inflation particularly in Turkiye increased sustaining capital and higher royalty expense partially offset by higher byproduct credits Exploration and evaluation expenditures are expected to be between 75 and 85 million in 2026 comprising 57 to 65 million of expensed and capitalized sustaining exploration and 18 to 20 million of exploration included in growth capital General and administrative expenses are expected to be between 40 and 45 million in 2026 and depreciation expense excluding Skouries is expected to be between 240 and 260 million Skouries depreciation expense is expected to be between 15 and 35 million CANADA Lamaque ComplexFor 2026 production guidance at the Lamaque Complex is expected to be between 185000 and 200000 ounces reflecting a wider range to account for the potential early start of Ormaque contingent on receiving the operating permit In 2026 the focus remains on the development of Ormaque and further resource conversion drilling at both Triangle and Ormaque Total cash costs and allin sustaining costs per ounce sold are expected to increase primarily due to higher direct operating costs associated with the deepening of the Triangle mine Additionally increases are expected as a result of increased labour costs reagents and consumables to support the Ormaque rampup Costs will also be impacted by a weaker foreign exchange rate and increased royalties reflecting the continued high gold prices Sustaining capital expenditures for 2026 are expected to range between 70 and 80 million lower than in 2025 due to the reclassification of ramp development at Triangle to growth capital Sustaining expenditures include continued development at Triangle delineation drilling major equipment replacement and refurbishment and work on the Sigma tailing storage facility Growth capital for 2026 is expected to range between 180 and 190 million and primarily covers development infrastructure and the fleet for Ormaque construction of the paste plant capital development for the Triangle ramp construction of the North Basin and the purchase of additional battery electric vehicles BEVs for the Triangle mine TURKIYE KisladagIn 2026 production guidance at Kisladag is expected between 105000 and 130000 ounces The higher metal price environment has opened up significant opportunity for the Kisladag open pit to allow us to evaluate the opportunity to move from a 1700 to a 2100 pit shell which is expected to open up the western area of the pit and support resource expansion To facilitate this opportunity and assist in resolving ongoing geotechnical challenges in the open pit we expect to increase waste stripping in 2026 by 6 to 8 million tonnes The mine optimization plan is expected to be beneficial in the longterm by improved balancing of ore and waste movement and supporting consistent yearoveryear performance The focus during 2026 is also on advancing key growth initiatives A larger secondary crusher ordered in 2025 is scheduled for delivery and installation by Q4 2026 and is expected to facilitate operational debottlenecking and reduce wear on the HPGR The geometallurgical study to characterize future mining phases and evaluate the potential benefits of additional screening for the HPGR is on track for completion in the first half of 2026 The two large agglomeration drums ordered in January are expected to be delivered and installed in 2027 These upgrades are anticipated to enhance permeability improve leach kinetics and shorten the leach cycle time unlocking additional value Total cash costs and allin sustaining costs per ounce sold are expected to be impacted by inflation not currently being fully offset by the depreciation of the Lira against the US dollar and increased royalties due to the anticipated continuation of high gold prices Planned 2026 sustaining capital of between 25 and 30 million primarily includes capitalized overhaul interlifts within the North Heap Leach Pad and geometallurgical drilling Planned 2026 growth capital of between 130 and 140 million includes the continuation of the capitalized waste stripping campaign the whole ore agglomeration construction the phased expansion of the North Heap Leach Pad and expansion of the carbon in leach CIC capacity EfemcukuruIn 2026 production guidance of 70000 to 80000 ounces is similar to the previously guided range Total cash costs and allin sustaining costs per ounce sold are expected to be negatively impacted by increased labour costs and electricity costs Higher labour costs are expected as a result of inflation not currently being fully offset by the depreciation of the Lira against the US dollar in addition to increase in hiring for Kokarpinar development Higher costs are also expected as a result of increased royalties due to the anticipated continuation of high gold prices Planned sustaining capital expenditures of between 20 and 25 million for 2026 includes underground development and equipment purchases The planned growth capital of between 25 and 30 million for 2026 is expected to be primarily focused on development and infrastructure for expansion of the Kokarpinar vein system including portal construction and development of the Bati vein systems Additionally it is expected that the mine will transition to selfperformance for capital development activities GREECE Olympias In 2026 production guidance of 70000 to 80000 ounces at Olympias is an increase in production from 2025 reflecting the commissioning and rampup of the 650 ktpa plant in the second half of the year However some engineering delays have slightly reduced the 2026 guidance from the previously guided range Operational focus will be to execute the plan while closely managing feed blends to balance mineral load and paste dilution which can impact performance of the flotation circuit The sites focus will also remain on driving sustainable improvements and longterm success through the continuation of the comprehensive site rejuvenation program This includes modernizing and optimizing the process plant and surrounding infrastructure as well as implementing a targeted leadership and skill development program to strengthen capabilities across all levels of the organization Total cash costs and allin sustaining costs per ounce sold are expected to be positively impacted by increased metal production and improved payability contracts Continued quarter to quarter variability in AISC and total cash costs are expected due to byproduct credits from timing of byproduct concentrate shipments Planned 2026 sustaining capital expenditures of between 25 and 30 million include underground mine development and management of the Kokkinolakas tailings management facility Planned 2026 growth capital of 40 to 45 million is primarily focused around the mill expansion to support the rampup to 650 ktpa capitalized development and a resource conversion drilling program Skouries First concentrate production is slightly delayed and is now expected in early Q3 2026 and commercial production in Q4 2026 The delay is estimated to have an approximately 50 million impact on the construction capital The slight delay to first concentrate and commercial production timing is due to iThe need to replace cyclone feed pump variable speed drive capacitors in the process plant main mill discharge cyclone feed which experienced moisture damage during storage Temporary replacement equipment has been ordered and is expected to be installed in Q2 2026 with permanent equipment in Q3 2026iiPower line connection delays have resulted from a slower than expected approval of the detailed engineering and delayed the rampup of the subcontractor Prior to commissioning final electrical regulatory authority approval requires completion of inspection and energization protocols The project team is actively implementing mitigation measures across all work areas to minimize the impact to the schedule and cost and to support a safe and orderly startup Skouries is a multidecade project that is projected to deliver positive cashflow and value from the second half of 2026 onwards ThreeYear Outlook Overview Eldorados strategy is focused on delivering consistent lowrisk production from longlife assets while driving a stepchange in cash flow generation through disciplined growth underpinned by the commencement of commercial production at Skouries in 2026 and the addition of copper a critical metal as a highmargin valueenhancing contributor to the existing portfolio Highlights Gold production of between 640000 and 740000 ounces by 2028 resulting in growth of 41 over the threeyear period compared to 2025 productionContinued focus on exploration to unlock the outstanding potential for new resources within the existing mineral tenure of our mine sites and nearmine property portfolio supporting the generation and drill testing of new targets for organic discovery and assessment of new opportunities in Eldorados core jurisdictions 202612202720282025 ActualGold Production 000 ozLamaque Complex185 2002190 210190 210187Kisladag105 130140 160140 160169Efemcukuru70 8065 8065 8072Olympias70 8075 9075 9060Skouries60 1001150 180170 200Total Gold Production490 590 620 720 640 740488Copper Production MlbsTotal Copper Production Skouries20 4050 7050 80Silver Production 000 ozTotal Silver Production Olympias1550 17501700 19001450 16501083Lead Production ktTotal Lead Production Olympias15 1817 2014 1710Zinc Production tTotal Zinc Production Olympias16 1919 2217 2010 Footnotes1Production includes precommercial production and commercial production from Skouries which is expected in Q4 20262Includes production anticipated from Ormaque dependent on permitting3These financial measures are nonIFRS financial measures Certain additional disclosures for nonIFRS financial measures and ratios have been incorporated by reference and additional detail can be found at the end of this news release and in the section NonIFRS and Other Financial Measures and Ratios of Eldorados December 31 2025 MDampA4Skouries AISC growth capital and sustaining capital post commercial production5Guidance provided is for existing Eldorado Gold assets only6Includes capitalized exploration at the Lamaque Complex Efemcukuru and Olympias7Payable metal produced8Olympias byproduct grades Silver 100 130 gt Zinc 46 51 Lead 38 439Skouries Copper grades 05 0710Totals may not add based on the averaging of costs11Skouries Growth and Sustaining Capital following commercial production expected in Q4 2026 Assumptions and Sensitivities Commodity and Currency Price AssumptionsGold oz4000Silver oz4500Copper lb500Lead mt2050Zinc mt2600USD CDN1 133EUR USD1 117USD TRY1 4600 1EUR USD expected to be 1115 in H1 and 1120 in H2 20262USD TRY expected to be 143 in Q1 145 in Q2 147 in Q3 and 149 in Q4 2026 Sensitivities2026ChangeOperating Sites Local Currency ExposureOperating Sites AISC oz soldGold Price400050060USD CDN1 1330059020EUR USD1 11750058515 Hedges Based on the Companys current assumptions underlying its 2026 cost estimates approximately 50 of the total Canadian dollar operating expense exposure for 2026 is hedged providing protection against adverse exchange rate movement below an average floor of USDCDN 130 while allowing participation in exchange rate movement up to an average of USDCDN 141 and approximately 50 of the total Euro exposure for Olympias operating expense for 2026 is hedged providing protection against adverse exchange rate movements above an average floor of EURUSD 125 while allowing participation in exchange rate movements down to an average of EURUSD 115 Current hedging positions are not factored into 2026 or future guidance Qualified Person Except as otherwise noted Simon Hille FAusIMM Executive Vice President Technical Services and Operations is the Qualified Person under National Instrument 43101 responsible for preparing and supervising the preparation of the scientific or technical information contained in this news release and for verifying the technical data disclosed in this document relating to our operating mines and development projects Jessy Thelland go OGQ No 758 a member in good standing of the Ordre des Gologues du Qubec is the Qualified Person as defined in National Instrument 43101 responsible for and has verified and approved the scientific and technical data contained in this news release for the Quebec projects Data is verified through the internal reviews of life of mine plans on a sitebysite basis which confirms the expected production outputs along with the expected revenue and cost distribution About Eldorado Eldorado is a gold and base metals producer with mining development and exploration operations in Canada Greece and Turkiye The Company has a highly skilled and dedicated workforce safe and responsible operations a portfolio of highquality assets and longterm partnerships with local communities Eldorados common shares trade on the Toronto Stock Exchange TSX ELD and the New York Stock Exchange NYSE EGO Contact Investor Relations Lynette Gould VP Investor Relations Communications amp External Affairs647 271 2827 or 1 888 353 8166 lynettegouldeldoradogoldcom Media Chad Pederson Director Communications and Public Affairs236 885 6251 or 1 888 353 8166 chadpedersoneldoradogoldcom NonIFRS and Other Financial Measures and Ratios Certain nonIFRS financial measures and ratios are included in this news release including total cash costs allin sustaining cost AISC growth capital costs and sustaining capital costs The Company believes that these measures and ratios in addition to conventional measures and ratios prepared in accordance with International Financial Reporting Standards IFRS provide investors an improved ability to evaluate the underlying performance of the Company The nonIFRS and other financial measures and ratios are intended to provide additional information and should not be considered in isolation or as a substitute for measures or ratios of performance prepared in accordance with IFRS These measures and ratios do not have any standardized meaning prescribed under IFRS and therefore may not be comparable to other issuers With respect to the nonIFRS measures disclosed in this news release the Company defines them as follows Total Cash Costs We define total cash costs following the recommendations of the Gold Institute Production Cost Standard The production cost standard developed by the Gold Institute remains the generally accepted standard of reporting total cash costs of production by gold mining companies Total cash costs include direct operating costs including mining processing and administration refining and selling costs including treatment refining and transportation charges and other concentrate deductions and royalty payments but exclude depreciation and amortization share based payments expenses and reclamation costs Revenue from sales of byproducts including silver lead and zinc reduce total cash costs AllIn Sustaining Costs AISC We define AISC based on the definition set out by the World Gold Council including the updated guidance note dated November 14 2018 We define AISC as the sum of total cash costs as defined above sustaining capital expenditure relating to current operations including capitalized stripping and underground mine development sustaining leases cash basis sustaining exploration and evaluation cost related to current operations including sustaining capitalized evaluation costs reclamation cost accretion and amortization related to current gold operations and corporate and allocated general and administrative expenses Corporate and allocated general and administrative expenses include general and administrative expenses sharebased payments and defined benefit pension plan expense Corporate and allocated general and administrative expenses do not include noncash depreciation As this measure seeks to reflect the full cost of gold production from current operations growth capital and reclamation cost accretion not related to operating gold mines are excluded Certain other cash expenditures including tax payments financing charges including capitalized interest except for financing charges related to leasing arrangements and costs related to business combinations asset acquisitions and asset disposals are also excluded Sustaining Capital Sustaining capital is capital required to maintain current operations at existing levels including capitalized stripping and underground mine development Sustaining capital excludes noncash sustaining lease additions unless otherwise noted and does not include capitalized interest expenditure related to development projects or other growth or sustaining capital not related to operating gold mines Growth Capital Growth capital is capital investment for new operations major growth projects or enhancement capital for significant infrastructure improvements at existing operations Our December 31 2025 Managements Discussion amp Analysis MDampA available on SEDAR at wwwsedarpluscom and on the Companys website under the Investors section contains explanations and discussions of historic total cash costs AISC sustaining capital and growth capital for the operating mines for the three and twelve months ended December 31 2025 For a discussion of the composition and usefulness of certain of these nonIFRS measures and a reconciliation of these historical measures to production costs see specifically NonIFRS and Other Financial Measures and Ratios in the Companys Management Discussion amp Analysis for the period ended December 31 2025 Forwardlooking Statements and Information Certain of the statements made and information provided in this news release are forwardlooking statements or forwardlooking information within the meaning of the United States Private Securities Litigation Reform Act of 1995 and applicable Canadian securities laws Often these forwardlooking statements and forwardlooking information can be identified by the use of words such as anticipates believes budgets committed continue estimates expects focus forecasts foresee forward future goal guidance intends opportunity outlook plans potential schedule strategy target underway working or the negatives thereof or variations of such words and phrases or statements that certain actions events or results can could likely may might will or would be taken occur or be achieved Forwardlooking statements and forwardlooking information contained in this press release includes but is not limited to statements or information with respect to expected 2026 guidance for the Company including expected gold production total cash costs allin sustaining costs AISC growth capital sustaining capital other growth capital and exploration expenditures for Skouries 2026 guidance on gold production copper production AISC production project capital accelerated operation capital postcommercial production growth capital and sustaining capital managements projection of forty percent gold production growth from 2025 to 2027 and the details related thereto managements beliefs with respect to the future impact of the Skouries project and future prospects of the Company generally expectations that gold production in 2026 will be second half weighted the Companys three year outlook including 2026 to 2028 production ranges for gold copper and other metals commodity and currency price assumptions with respect to Skouries the expected timeline to first production and first commercial production the expected impact of a delay in first production and first commercial production and expected activities required to address the delay managements expectations that the project will deliver significant positive cashflow and value and the timing related thereto and managements intention to produce additional guidance for the project with respect to Kisladag intentions to install a larger secondary crusher and the benefits therefrom intentions to complete a geometallurgical study and the timing related thereto expected reductions to production in 2026 and the reasons related thereto expected benefits of increased waste stripping in 2026 expected timing in relation to the delivery and installation of two agglomeration drums expected 2026 activities comprising sustaining and growth capital with respect to Efemcukuru expected negative impacts of labour and electricity costs expected higher royalty rates expected 2026 activities comprising sustaining expenditures and growth capital and intentions to transition to selfperformance for capital development activities with respect to Olympias intentions to complete a mill expansion to 650 ktpa in 2026 and the expected benefits therefrom expected reductions to the 2026 guidance range the reasons related thereto intentions with respect to the process plan and a leadership and skill development program expected 2026 activities comprising sustaining expenditures and growth capital with respect to the Lamaque Complex intentions to progress to full scale development of the Ormaque deposit and its contingency on receiving the operating permit plans to complete resource conversion drilling at Triangle and Ormaque expected 2026 activities comprising sustaining expenditures and growth capital and generally our strategy plans and goals including our proposed exploration development construction permitting financing and operating potential plans and priorities and related timelines and schedules Forwardlooking statements and forwardlooking information are by their nature based on a number of assumptions that management considers reasonable However such assumptions involve both known and unknown risks uncertainties and other factors which if proven to be inaccurate may cause actual results activities performance or achievements may be materially different from those described in the forwardlooking statements or information These include assumptions concerning timing cost and results of our construction and development activities improvements and exploration the future price of gold copper and other commodities receipt of all required permits on the timelines we expect the global concentrate market exchange rates anticipated values costs expenses and working capital requirements our ability to continue accessing our project funding and remain in compliance with all covenants and contractual commitments related thereto availability of labour resources including for construction development and improvements activities production and metallurgical recoveries Mineral Reserves and Mineral Resources our ability to effectively use invested capital and unlock potential expansion opportunities across the portfolio our ability to address the negative impacts of climate change and adverse weather consistency of agglomeration and our ability to optimize it in the future the cost of and extent to which we use essential consumables including fuel explosives cement and cyanide the impact and effectiveness of productivity initiatives the time and cost of shipping for important or critical items for construction development and improvements activities or necessary for anticipated overhauls of equipment expected byproduct grades the use and impact or effectiveness of growth capital the impact of acquisitions dispositions suspensions or delays on our business the sustaining capital required for various projects and the geopolitical economic permitting and legal climate that we operate in More specifically with respect to the Skouries Project and updates we have made additional assumptions regarding our ability and our contractors ability to recruit and retain labour resources within the required timeline labour productivity rates and expected hours inflation rates the expected scope of project management frameworks our ability to continue executing our plans relating to the Skouries Project on the estimated existing project timeline and consistent with the current planned project scope the timeliness of shipping for important or critical items our ability to continue accessing our project funding and remain in compliance with all covenants and contractual commitments related thereto our ability to obtain and maintain all required approvals and permits both overall and in a timely manner the absence of further previously unidentified archaeological discoveries which would delay construction of various portions of the project the future price of gold copper and other commodities and the broader community engagement and social climate in respect of the Skouries Project In addition except where otherwise stated Eldorado has assumed a continuation of existing business operations on substantially the same basis as exists at the time of this news release Even though we believe that the assumptions and expectations represented by such statements or information are reasonable there can be no assurance that the forwardlooking statement or information will prove to be accurate Many assumptions may be difficult to predict and are beyond our control Forwardlooking statements and forwardlooking information are subject to known and unknown risks uncertainties and other important factors that may cause actual results activities performance or achievements to be materially different from those described in the forwardlooking statements or information These risks uncertainties and other factors include among others commodity price risk development risks at Skouries and other construction and development projects including the ability of key suppliers to meet key contractual commitments in terms of schedules amount of product delivered cost or quality and our ability to construct key infrastructure within the required timelines and unexpected inclement weather and climate events that may delay timelines risks relating to our operations in foreign jurisdictions risks related to production and processing risks related to our improvement projects our ability to secure supplies of power and water at a reasonable cost prices of commodities and consumables our reliance on significant amounts of critical equipment our reliance on infrastructure commodities and consumables inflation risk community relations and social license environmental matters our ability to completely understand geotechnical structures geotechnical and hydrogeological conditions or failures regulatory requirements as they relate to mine plan approvals waste disposal mineral tenure permits nongovernmental organizations reputational issues climate change change of control actions of activist shareholders estimation of Mineral Reserves and Mineral Resources risks related to replacement of mineral reserves regulatory reviews and different standards used to prepare and report Mineral Reserves and Mineral Resources risks relating to any pandemic epidemic endemic or similar public health threats regulated substances the acquisition of Foran Mining Corporation including timing risks and benefits thereof acquisitions including integration risks dispositions coownership of our properties investment portfolio volatility volume fluctuations and dilution risk in respect of our shares competition reliance on a limited number of smelters and offtakers information and operational technology systems liquidity and financing risks indebtedness including current and future operating restrictions implications of a change of control ability to meet debt service obligations the implications of defaulting on obligations and changes in credit ratings total cash costs per ounce and AISC particularly in relation to the market price of gold and the Companys profitability currency risk interest rate risk credit risk tax matters financial reporting including relating to the carrying value of our assets and changes in reporting standards the global economic environment labour including in relation to availability of labour resources including for including for construction development and improvements activities and their productivity employeeunion relations employee misconduct key personnel skilled workforce expatriates and contractors commodity price risk default on obligations current and future operating restrictions reclamation and longterm obligations credit ratings change in reporting standards the unavailability of insurance SarbanesOxley Act applicable securities laws and stock exchange rules risks relating to environmental sustainability and governance practices and performance corruption bribery and sanctions employee misconduct litigation and contracts conflicts of interest compliance with privacy legislation dividends tariffs and other trade barriers and those risk factors discussed in our most recent Annual Information Form amp Form 40F The reader is directed to carefully review the detailed risk discussion in our most recent Annual Information Form amp Form 40F filed on SEDAR and EDGAR under our Company name which discussion is incorporated by reference in this news release for a fuller understanding of the risks and uncertainties that affect our business and operations With respect to the Skouries Project these risks uncertainties and other factors may cause further delays in the completion of the construction and commissioning at the Skouries Project which in turn may cause delays in the commencement of production and further increase to the costs of the Skouries Project The specific risks certainties and other factors include among others increase the costs of the Skouries Project The specific risks uncertainties and other factors include among others our ability and the ability of our construction contractors to recruit the required number of personnel both skilled and unskilled with required skills within the required timelines and to manage changes to workforce numbers through the construction of the Skouries Project our ability to recruit personnel having the requisite skills experience and ability to work on site our ability to increase productivity by adding or modifying labour shifts rising labour costs or costs of key inputs such as materials power and fuel risks related to thirdparty contractors including reduced control over aspects of the Companys operations andor the ability of contractors to perform at required levels and according to baseline schedules the ability of key suppliers to meet key contractual commitments in terms of schedules amount of product delivered cost or quality our ability to construct key infrastructure within the required timelines including the process plant filter plant waste management facilities and embankments differences between projected and actual degree of prestrip required in the open pit variability in metallurgical recoveries and concentrate quality due to factors such as extent and intensity of oxidation or presence of transition minerals presence of additional structural features impacting hydrological and geotechnical considerations variability in minerals or presence of substances that may have an impact on filtered tails performance and resulting bulk density of stockpiles or filtered tails distribution of sulfides that may dilute concentrate and change the characteristics of tailings unexpected disruptions to operations due to protests nonroutine regulatory inspections road conditions or labour unrest unexpected inclement weather and climate events including short and long duration rainfall and floods our ability to meet precommercial producing mining or underground development targets unexpected results from underground stopes new archaeological discoveries requiring the completion of a regulatory process changes in support from local communities our ability to meet the expectations of communities governments and stakeholders related to the Skouries Project and timely receipt of necessary permits and authorizations Our project capital and accelerated operational capital costs at Skouries are incurred primarily in Euros but are reported in US dollars and are therefore sensitive to fluctuations in the EURUSD exchange rate The inclusion of forwardlooking statements and information is designed to help you understand managements current views of our near and longerterm prospects and it may not be appropriate for other purposes There can be no assurance that forwardlooking statements or information will prove to be accurate as actual results and future events could differ materially from those anticipated in such statements Accordingly you should not place undue reliance on the forwardlooking statements or information contained herein Except as required by law we do not expect to update forwardlooking statements and information continually as conditions change and you are referred to the full discussion of the Companys business contained in the Companys reports filed with the securities regulatory authorities in Canada and the United States This news release contains information that may constitute futureorientated financial information or financial outlook information collectively FOFI about Eldorados prospective financial performance financial position or cash flows all of which is subject to the same assumptions risk factors limitations and qualifications as set forth above Readers are cautioned that the assumptions used in the preparation of such information although considered reasonable at the time of preparation may prove to be imprecise or inaccurate and as such undue reliance should not be placed on FOFI Eldorados actual results performance and achievements could differ materially from those expressed in or implied by FOFI Eldorado has included FOFI in order to provide readers with a more complete perspective on Eldorados future operations and managements current expectations relating to Eldorados future performance Readers are cautioned that such information may not be appropriate for other purposes FOFI contained herein was made as of the date of this press release Unless required by applicable laws Eldorado does not undertake any obligation to publicly update or revise any FOFI statements whether as a result of new information future events or otherwise

REV Announces Strategic Asset Monetization, Corporate Rebranding and Marketing Program
REV transaction with Major Gold Corp will unlock value of Chibougamau gold propertiesCorporate rebranding will highlight REVs Aden Dome Project and its targeting of Americas Northern Great Plains states for Helium and Natural Hydrogen REV maintains strong exposure to Canadas firstever Natural Hydrogen discoveries in Saskatchewan with ownership of 6 million shares of MAX Power Mining Corp New REV Corporate Video httpsyoutubebiOHmBtI8ns VANCOUVER British Columbia Feb 19 2026 GLOBE NEWSWIRE REV Exploration Corp REV or the Company TSXV REVX is pleased to announce a strategic transaction to unlock the value of its gold assets in Northern Quebec allowing for an intense focus on the upside potential of its Helium and Natural Hydrogen interests in Americas Northern Great Plains including along the Montana border with Alberta and Saskatchewan Concurrently REV has initiated a corporate rebranding with a new logo and soontobelaunched new website in advance of efforts to increase exposure of REV Exploration in the United States and Europe wwwREVexplorationcom Strategic Asset Monetization Deal with Major Gold Corp REV has entered into a mineral property purchase agreement with Major Gold Corp MGC a British Columbia reporting issuer pursuant to which MGC will acquire a 100 interest in REVs package of mining claims the Assets comprising approximately 50000 hectares in the Chibougamau region of QuebecREV will receive 12400000 common shares in the capital of MGC the Transaction and is expected to become the majority shareholder of MGC At a future date REV may consider a distribution of shares in Major Gold as a special dividend to REV shareholdersMajor Gold Corp is planning to commence a drill program in the Chibougamau Camp in the coming weeks and is also anticipating pursuing a listing of its common shares on the TSX Venture Exchange TSXV Helium amp Natural Hydrogen Northern Great Plains REV is assembling a package of highvalue Helium and Natural Hydrogen drill targets on the Montana border with Alberta and Saskatchewan highlighted by its drillready Aden Dome asset and has also initiated a land acquisition program targeting Helium and Natural Hydrogen discoveries in Americas Northern Great Plains refer to Feb 4 2026 news releaseMr Steve Halabura MAX Powers Chief Geoscientist is REVs Lead Technical Advisor and has a deep knowledge of industrial gases and how structures hosting deposits of Helium and Natural Hydrogen extend from Saskatchewan and Alberta into Americas Northern Great Plains statesREV owns 6 million shares or approximately 5 of MAX Power Mining Corp CSE MAXX OTC MAXXF which recently reported Canadas firstever drilling discovery of a Natural Hydrogen system near Central Butte Saskatchewan Corporate Rebranding and Marketing Programs REV has unveiled a new corporate logo reflective of its emphasis on Americas Northern Great Plains states and will soon launch a new website at wwwREVexplorationcom with the intent to leverage a much larger audience in the United States and overseasFurther to its agreement announced October 3 2025 REV has completed payment of 250000 USD to i2i Marketing Group LLC a Floridabased firm to provide corporate marketing and investor awareness services to REVREV has entered into an agreement with Stockchain Capital LLC to provide Investor Relations services tailored to a German audience see details further below Mr Jordan Potts REV Exploration CEO commented The transaction with Major Gold is value accretive as REV will own a large share position in a company with very aggressive plans for exploration across a portfolio of properties representing one of the largest land positions after IAMGOLD in the entire Chibougamau Gold Camp This will allow REV to focus its energies and capital on becoming a leading Helium and Natural Hydrogen company focused on Americas Northern Great Plains and the MontanaAlberta MontanaSaskatchewan border areas After completing a 58 million private placement in January 2026 with Eric Sprott as the lead order REV Exploration has a strong treasury 5 ownership of MAX Power and an attractive share structure with only 53 million shares outstanding and 42 million warrants The corporate rebranding is aimed at significantly expanding investor awareness of REV in the United States REVMajor Gold Mineral Property Purchase Agreement Under the terms of the Agreement REV will transfer a 100 interest in the Assets to MGC in exchange for 12400000 common shares in the capital of MGC the Transaction Following completion of the Transaction REV is expected to be the majority shareholder of MGC In addition the Agreement provides that REV will have the right to nominate two members to the board of directors of MGC No finders fees are payable in connection with the Transaction MGC is currently anticipating pursuing a listing of its common shares on the TSX Venture Exchange TSXV subject to receipt of all required regulatory approvals and the completion of additional financing REV views the Transaction as a strategic opportunity to unlock value from the Chibougamau asset package which had not been a core focus of the Companys current exploration strategy while retaining meaningful exposure and influence through a significant equity position REV intends to remain a strong longterm and supportive shareholder of MGC and to work closely with the company to advance the Assets in a capitalefficient manner Following completion of the Transaction REV will further accelerate its efforts toward advancing its flagship Aden Dome asset and other Helium and Natural Hydrogen interests it may acquire Closing of the Transaction remains subject to customary closing conditions including receipt of all required regulatory approvals including approval of the TSX Venture Exchange as applicable MarketingInvestor Relations Agreement Effective February 13 2026 REV entered into a consulting agreement the Agreement with Stockchain Capital LLC Stockchain to provide investor relations services in compliance with the policies and guidelines of the TSXV and other applicable securities legislation Stockchain is a capital markets advisory and communications firm whose principal is Hai Nam Tran Stockchains business address is 3833 Powerline Rd Suite 801T Fort Lauderdale Florida 33309 USA and the firm can be contacted at llcstockchainio Neither Stockchain nor its principals currently own any securities of the Company however they may purchase securities of the Company from time to time for investment purposes Stockchain and its principals are at arms length to the Company Under the Agreement Stockchain will provide investor relations services targeted toward a German investor audience and will disseminate Companyapproved information to increase public awareness in accordance with applicable securities regulations The Agreement has a term of twelve 12 weeks and provides for a consulting fee of USD 240000 payable in a single installment from the Companys working capital The Agreement is subject to approval of the TSXV About REV Exploration Corp REV is a mineral exploration company with a diversified portfolio of strategic mining assets together with meaningful and growing exposure to the Helium and Natural Hydrogen sectors in Western Canada and the Western United States The Company has acquired a 100 interest in a series of PNG leases along the AlbertaMontana border including the drillready Aden Dome Project and also owns 6 million shares or approximately 5 of MAX Power Mining Corp which recently made Canadas firstever drilling discovery of Natural Hydrogen in Saskatchewan For further information on the Company readers are referred to the Companys website at wwwREVexplorationcomand its Canadian regulatory filings on SEDAR at wwwsedarplusca REV Exploration Corp Suite 410 325 Howe StreetBC V6C 1Z7 Tel 6046827970inforevexplorationcomREVexplorationcomJordan Potts CEO Director For further information please contact Chad LevesqueInvestor Relations13069814753inforevexplorationcom Cautionary Statement on ForwardLooking Information This news release contains forwardlooking information and forwardlooking statements within the meaning of applicable Canadian securities legislation collectively forwardlooking information Forwardlooking information includes but is not limited to statements regarding the completion of the transaction contemplated by the mineral property purchase agreement the satisfaction of customary closing conditions and the receipt of all required regulatory and TSX Venture Exchange approvals the anticipated ownership position and governance rights of REV in Major Gold Corp following closing Major Gold Corps intention to pursue a listing on the TSX Venture Exchange and complete additional financing the anticipated advancement development and potential value of the Asset to REV and or its shareholders REVs future exploration development and capital allocation plans including its continued focus on the Aden Dome project and the expected benefits of the Transaction to REV and its shareholders Forwardlooking information is based on managements reasonable assumptions beliefs expectations and estimates as of the date of this news release including assumptions regarding the ability of the parties to complete the Transaction on the terms described or at all satisfy closing conditions obtain all required regulatory and Exchange approvals complete any necessary financing and maintain general business market regulatory and economic conditions Forwardlooking information is subject to known and unknown risks uncertainties and other factors that may cause actual results performance or achievements to differ materially from those expressed or implied by such forwardlooking information These risks and uncertainties include but are not limited to the risk that the Transaction may not be completed as anticipated or at all the risk that required regulatory Exchange or thirdparty approvals are not obtained on a timely basis or on acceptable terms financing risk changes in market conditions fluctuations in commodity prices exploration and operational risks earlystage project risks the absence of defined mineral resources or reserves uncertainties inherent in mineral exploration and development environmental permitting and regulatory risks reliance on key management and technical personnel and other risks and uncertainties inherent in the mineral exploration industry Additional risks and uncertainties applicable to the Company are described in detail in the Companys most recently filed annual information form managements discussion and analysis and other continuous disclosure documents available under the Companys profile on SEDAR at wwwsedarplusca Readers are encouraged to review these filings for a more complete discussion of the risks facing the Company Forwardlooking information speaks only as of the date of this news release and the Company undertakes no obligation to update or revise any forwardlooking information whether as a result of new information future events or otherwise except as required by applicable securities laws Readers are cautioned not to place undue reliance on forwardlooking information Neither the TSX Venture Exchange nor its Regulation Services Provider as that term is defined in the policies of the TSX Venture Exchange accepts responsibility for the adequacy or accuracy of this release

XCF Global, Southern Energy Renewables and DevvStream Agree to Binding Term Sheet for Three-Party Merger
HOUSTON Texas and SACRAMENTO California Jan 26 2026 GLOBE NEWSWIRE XCF Global Inc XCF Nasdaq SAFX a key player in decarbonizing the aviation industry through sustainable aviation fuel SAF and DevvStream Corp Nasdaq DEVS DevvStream a leading carbon management and environmentalasset monetization firm today announced that they have agreed to a binding term sheet to combine Southern Energy Renewables Inc Southern together the Parties in a threeparty merger If the Parties are able to successfully negotiate a definitive agreement the Parties believe the combined entity will form an integrated platform of complementary assets with the opportunity to deploy a disciplined and proprietary environmental attribute and credit generation strategy across North America and emerging markets The binding term sheet establishes a framework for collaboration and mutual understanding among the Parties The proposed transaction is intended to reinforce the development of a lowcarbon fuels platform designed to accelerate SAF via HEFA emethanol emethanoltojet fuel pathways expand domestic production capacity and integrate environmentalattribute monetization into a unified customer offering As part of the evaluation and negotiation of the definitive transaction agreement the Parties plan to explore opportunities for integrating small modular reactor SMR nuclear power with electrosustainable aviation fuel eSAF AI data center power and associated environmental attribute structures Entry into definitive transaction agreements is subject to review and approval by the Boards of Directors of the respective companies As part of the binding term sheet an investor has agreed to purchase shares of XCF to fund nearterm operations and critically to complete targeted upgrades and modifications at XCFs New Rise Reno refinery These funds are intended to be used to complete required mechanical electrical and process upgradesprocure catalyst utilities and supporting infrastructurefinalize commissioning and reliability improvements andconduct certain shareholder relations activities related to the updates and modifications at XCFs New Rise Reno refinery The ultimate objective of the incremental funding is to bring the New Rise Reno facility into sustained commercial production and support the rampup of SAF output Chris Cooper Chief Executive Officer of XCF commented We are excited to formalize a proposed final structure with DevvStream and Southern on what we believe will be a very accretive and excellent opportunity We believe this combination has the potential to further validate the value XCF brings to the SAF industry while increasing shareholder value and providing alternative clean fuel opportunities If consummated this merger has the potential to solidify our footprint in North America as the supreme SAF producer Sunny Trinh Chief Executive Officer of DevvStream commented We believe the next phase of SAF adoption will favor USbased platforms that can move quickly operate at scale and better integrate environmental attributes into the fuel value chain to support project economics and customer confidence If progressed this merger would bring together complementary strengthsXCFs scale and speedtomarket Southerns biomass feedstock focus and DevvStreams environmentalasset capabilitieswith the shared objective of building a globally competitive lowcarbon fuels platform grounded in real operating execution Jay Patel Chief Executive Officer of Southern Energy Renewables added Southerns approach is centered on sustainable biomass feedstocks and scalable fuel pathways and we see meaningful potential in combining that focus with XCFs production footprint and ability to accelerate commercialization Subject to completing the necessary documentation and approvals we believe this collaboration could create a USbased platform that can compete globally About XCF Global Inc XCF Global Inc XCF Nasdaq SAFX is an emerging sustainable aviation fuel company dedicated to accelerating the aviation industrys transition to netzero emissions Our flagship facility New Rise Reno has a permitted nameplate production capacity of 38 million gallons per year positioning XCF as an early mover among largescale SAF producers in North America XCF is working to advance a pipeline of potential expansion opportunities in Nevada North Carolina and Florida and to build partnerships across the energy and transportation sectors to scale SAF globally XCF is listed on the Nasdaq Capital Market and trades under the ticker SAFX To learn more visit wwwxcfglobal About DevvStream DevvStream Nasdaq DEVS is a carbon management company focused on the development investment and sale of environmental assets worldwide including carbon credits and renewable energy certificates About Southern Energy Renewables Southern Energy Renewables Inc is a USbased clean fuels chemicals and products developer focused on advancing largescale biomasstofuels projects These projects are designed to produce carbonnegative SAF and green methanol supported by integrated carbon capture and sequestration ContactGreg Savaresegsavaresexcfglobal DEVSalphaircom4083654348 Additional Information and Where to Find It In connection with the proposed business combination transaction among DevvStream Southern and Sierra Merger Sub Inc DevvStream expects that XCF will prepare and file relevant materials with the Securities and Exchange Commission the SEC including a registration statement on Form S4 that will contain preliminary proxy statements of DevvStream and XCF that also constitutes a prospectus of XCF the Proxy StatementsProspectus in connection with the proposed business combination transaction A definitive proxy statement is expected to be mailed to stockholders of DevvStream and XCF as of a record date to be established for voting on the proposed business combination transaction and other matters as described in the Proxy StatementsProspectus DevvStream XCF and Southern may also file other documents with the SEC and Canadian securities regulatory authorities regarding the proposed transaction This communication is not a substitute for any proxy statement registration statement or prospectus or any other document that DevvStream and Southern as applicable may file with the SEC or Canadian securities regulatory authorities in connection with the proposed transaction BEFORE MAKING ANY VOTING OR INVESTMENT DECISION INVESTORS AND SECURITY HOLDERS OF DEVVSTREAM ARE URGED TO READ CAREFULLY AND IN THEIR ENTIRETY THE PROXY STATEMENTSPROSPECTUS WHEN IT BECOMES AVAILABLE AND ANY OTHER RELEVANT DOCUMENTS THAT ARE FILED OR WILL BE FILED BY DEVVSTREAM OR SOUTHERN WITH THE SEC OR CANADIAN SECURITIES REGULATORY AUTHORITIES AS WELL AS ANY AMENDMENTS OR SUPPLEMENTS TO THESE DOCUMENTS IN CONNECTION WITH THE PROPOSED TRANSACTION WHEN THEY BECOME AVAILABLE BECAUSE THESE DOCUMENTS CONTAIN OR WILL CONTAIN IMPORTANT INFORMATION ABOUT THE PROPOSED TRANSACTION AND RELATED MATTERS DevvStreams investors and security holders will be able to obtain free copies of the Proxy StatementProspectus when they become available as well as other filings containing important information about DevvStream Southern and other parties to the proposed transaction without charge through the website maintained by the SEC at wwwsecgov Copies of the documents filed with the SEC by i XCF will be available free of charge under the tab Financials on the Investors page of the XCFs website at httpsxcfglobalinvestorrelationsfinancialssecfilings or by contacting the XCFs Investor Relations Department at safxxcfglobal and ii DevvStream will be available free of charge under the tab Financials on the Investor Relations page of DevvStreams website at wwwdevvstreamcominvestors or by contacting DevvStreams Investor Relations Department at irdevvstreamcom Participants in the Solicitation DevvStream Southern XCF EEME and their respective directors and certain of their respective executive officers and employees may be deemed to be participants in the solicitation of proxies from DevvStreams and XCFs stockholders in connection with the proposed transaction Information regarding directors and executive officers of i XCF is contained in a Current Report on Form 8KA file with the SEC on October 31 2025 and in other documents subsequently filed with the SEC and ii DevvStream is contained in DevvStreams proxy statement for its 2025 annual meeting of stockholders filed with the SEC on November 18 2025 and in other documents subsequently filed with the SEC Additional information regarding the participants in the proxy solicitations and a description of their direct or indirect interests by security holdings or otherwise will be contained in the Proxy StatementProspectus and other relevant materials filed with the SEC when they become available These documents can be obtained free of charge from the sources indicated aboveNo Offer or Solicitation This press release is for informational purposes only and is not intended to and does not constitute an offer to sell or the solicitation of an offer to buy any securities or a solicitation of any vote or approval nor shall there be any offer solicitation or sale of securities in any jurisdiction in which such offer solicitation or sale would be unlawful prior to registration or qualification under the securities laws of any such jurisdiction No offer of securities shall be made except by means of a prospectus meeting the requirements of Section 10 of the Securities Act of 1933 as amended Cautionary Note Regarding ForwardLooking Statements This press release contains forwardlooking statements within the meaning of Section 27A of the Securities Act of 1933 as amended and Section 21E of the Securities Exchange Act of 1934 as amended that involve substantial risks and uncertainties including statements regarding the binding term sheet the proposed transactions contemplated thereby the anticipated structure timing and conditions of the proposed transaction the anticipated completion of the plant conversion specified in the binding term sheet for the proposed transaction the achievement of specified financial and operational milestones including annualized blended fuel product revenues in excess of 10 billion and minimum annualized EBITDA of 100 million the anticipated issuance of statesupported bonds by Southern the valuation the parties are aiming to achieve following the consummation of the proposed transaction and the expected benefits of the proposed transaction All statements other than statements of historical facts are forwardlooking statements including statements regarding the expected timing structure and terms of the proposed transaction the ability of the parties to complete the proposed transaction considering the various closing conditions the expected or targeted benefits of the proposed transaction legal economic and regulatory conditions and any assumptions underlying any of the foregoing Forwardlooking statements concern future circumstances and results and other statements that are not historical facts and are sometimes identified by words such as aim may will should potential intend expect endeavor seek anticipate estimate overestimate underestimate believe plan could would project predict continue target objective goal designed or the negatives of these words or other similar expressions that concern XCFs DevvStreamsor Southerns expectations strategy priorities plans or intentions Forwardlooking statements are based upon current plans estimates expectations and assumptions that are subject to risks uncertainties and assumptions Should one or more of these risks or uncertainties materialize or should underlying assumptions prove incorrect actual results may differ materially from those expressed or implied by such forwardlooking statements We can give no assurance that such plans estimates or expectations will be achieved and therefore actual results may differ materially from any plans estimates or expectations in such forwardlooking statements Forwardlooking statements are based on current expectations estimates assumptions and projections and involve known and unknown risks and uncertainties that may cause actual results developments or outcomes to differ materially from those expressed or implied by such statements Important factors that could cause actual results developments or outcomes to differ materially include among others 1 changes in domestic and foreign business market financial political regulatory and legal conditions 2 the risk that the plant conversion specified in the term sheet for the proposed transaction is delayed not completed on the anticipated timeline or requires additional capital beyond current expectations 3 the risk that XCF is unable to achieve the specified annualized revenue and EBITDA thresholds contemplated by the term sheet which depend in significant part on XCFs business performance operating results market demand execution capabilities and other factors 4 the risk that Southern does not receive authorization to issue up to 400 million of bonds that such bonds are delayed issued on less favorable terms or not issued at all 5 the risk that XCF is unable to obtain or maintain compliance with applicable Nasdaq continued listing standards including regaining compliance with 100 minimum bid price requirement which could result in delisting if compliance is not regained within applicable cure periods 6 the risk that negotiations among the parties relating to the term sheet or any contemplated definitive agreements are delayed modified suspended or terminated including as a result of alleged breaches or differing interpretations of the binding provisions of the term sheet 7 the inability of the parties to agree on mutually acceptable definitive agreements or to satisfy or waive the closing conditions contemplated by the term sheet 8 the occurrence of events changes or other circumstances that could give rise to the termination of the term sheet or any related negotiations or that could result in disputes or litigation relating to the interpretation enforceability or performance of the binding provisions of the term sheet 9 the outcome of any legal proceedings that may be instituted against XCF DEVS Southern EEME or their respective affiliates which could be costly timeconsuming divert management attention and adversely affect liquidity or financial condition 10 uncertainty with respect to the scope timing or completion of due diligence by any party and each partys satisfaction therewith 11 uncertainty regarding valuations capital structure financing arrangements equity ownership or the allocation of economic interests contemplated by the term sheet including the risk that in the event the proposed transaction closes the parties may never achieve their aim of creating a 30 billion combined enterprise as of the date hereof this statement only represents an objective that the parties intend to achieve on a future date and such objective has not in the past and may never in the future be achieved 12 changes to the structure timing or terms of any proposed transaction that may be required or deemed appropriate as a result of applicable laws regulations accounting considerations stock exchange requirements or regulatory guidance 13 the risk that required regulatory governmental stock exchange or stockholder approvals are not obtained are delayed or are subject to conditions that could adversely affect the parties or the expected benefits of any contemplated transaction 14 the risk that the announcement of the term sheet or the pursuit of the contemplated transactions disrupts current plans operations or relationships of XCF DEVS or Southern 15 the risk that anticipated benefits of any contemplated transaction are not realized due to competition execution challenges market conditions or the inability to grow and manage operations profitably 16 costs expenses and management distraction associated with the term sheet negotiations potential litigation and any contemplated transactions 17 changes in applicable laws regulations or enforcement priorities including extensive regulation and compliance obligations applicable to the parties businesses and 18 other economic business competitive operational or financial factors beyond managements control including those set forth in i XCFs filings with the SEC including the final proxy statementprospectus relating to the Business Combination filed with the SEC on February 6 2025 this Press Release and other filings XCF made or will make with the SEC in the future and ii DevvStreams Form 10K for the fiscal year ended July 31 2025 filed with the SEC on November 6 2025 and subsequent reports filed with SEC and Canadian securities regulatory authorities available on DevvStreams profile at wwwsedarplusca Although the binding term sheet provides that certain provisions are binding on the parties it does not obligate the parties to consummate the proposed transaction The consummation of the proposed transaction remains subject to the negotiation execution and delivery of definitive agreements and the satisfaction or waiver of applicable closing conditions and the binding term sheet may be terminated in accordance with its terms There can be no assurance that any definitive agreements will be entered into or that the proposed transaction will be consummated on the terms described herein or at all Investors are cautioned not to place undue reliance on these forwardlooking statements which speak only as of the date hereof and are not guarantees of future performance or outcomes Any forwardlooking statements speak only as of the date of this communication Neither DevvStream XCF Southern or EEME undertakes any obligation to update any forwardlooking statements whether as a result of new information or developments future events or otherwise except as required by law Neither future distribution of this communication nor the continued availability of this communication in archive form on DevvStreams website at wwwdevvstreamcominvestors or XCFs website at wwwxcfglobalinvestorrelations should be deemed to constitute an update or reaffirmation of these statements as of any future date

Volta Foundation Releases the 2025 Battery Report, the Most Comprehensive Analysis of the Global Battery Industry
2025 Battery Report The 2025 Battery Report is now available at httpsvoltafoundationbatteryreport2025 LOS ANGELES Jan 24 2026 GLOBE NEWSWIRE Volta Foundation today announced the release of the 2025 Battery Report the sixth edition of the worlds most widely read report on the battery industry Since the launch of the inaugural Battery Report in 2020 the series has generated more than 500000 views worldwide delivering an unparalleled endtoend view of the technologies markets supply chains policy dynamics and workforce shaping the future of energy storage Developed through one of the largest collaborative efforts in the industry the 2025 Battery Report brings together insights from more than 15 global advisors 30 expert authors and 120 contributors spanning industry academia research finance and policy This collaborative approach ensures the report reflects both cuttingedge research and realworld deployment realities across the battery value chain The battery industry is no longer emerging its becoming foundational infrastructure said Michael Liu Director of Research amp Insights at Volta Foundation Decisions being made today around technology supply chains policy and talent will shape the next several decades and this Battery Report provides a shared factual baseline at a moment when clarity matters more than ever An Authoritative Resource for a Rapidly Evolving IndustryThe 2025 edition covers critical developments across Battery chemistries and materialsCell pack and manufacturing innovationsGlobal EV and stationary energy storage marketsSupply chains recycling and secondary marketsPolicy geopolitics and regional dynamicsTalent workforce and academia By curating publicly available data and expert analysis into a single openaccess resource the report provides actionable insights grounded in current verifiable research and is the goto resource for all battery professionals Industry and Academic Leaders Weigh InThe impact of the Volta Battery Report is reflected in the voices of its advisors and contributors The Volta Foundations annual Battery Report is an essential resource for anyone in the battery industry providing a detailed overview of the current state of the market and its future direction The value of an openaccess resource like the Battery Report cannot be understated it helps new entrants build their base knowledge provides governments and policymakers with the information needed to inform their decisions and offers investors an overview of market dynamics to guide their investment strategies James Frith Principal at Volta Energy Technologies Powered by a Global EcosystemThe 2025 Battery Report is supported by collaboration across the global battery industry including industry and data partners Benchmark Mineral Intelligence CRU Group BloombergNEF Wood Mackenzie Roland Berger and Sightline Climate reinforcing Volta Foundations mission to provide neutral openaccess knowledge that accelerates innovation and informed decisionmaking AvailabilityThe 2025 Battery Report is available digitally at httpsvoltafoundationbatteryreport2025 A public downloadable release will follow later in Q1 2026 About Volta FoundationVolta Foundation is the worlds largest network of battery professionals As a global notforprofit association of more than 75000 battery professionals and 200 member companies Volta Foundation produces publications networking opportunities and industry resources to foster collaboration innovation and advocacy within the battery industry Media InformationDana BubonovichVice President Business Operations Volta Foundationdanavoltafoundation1 6503748199 A photo accompanying this announcement is available at httpswwwglobenewswirecomNewsRoomAttachmentNg6a86f5414ec34f1b9bc290c0eafaca8c